
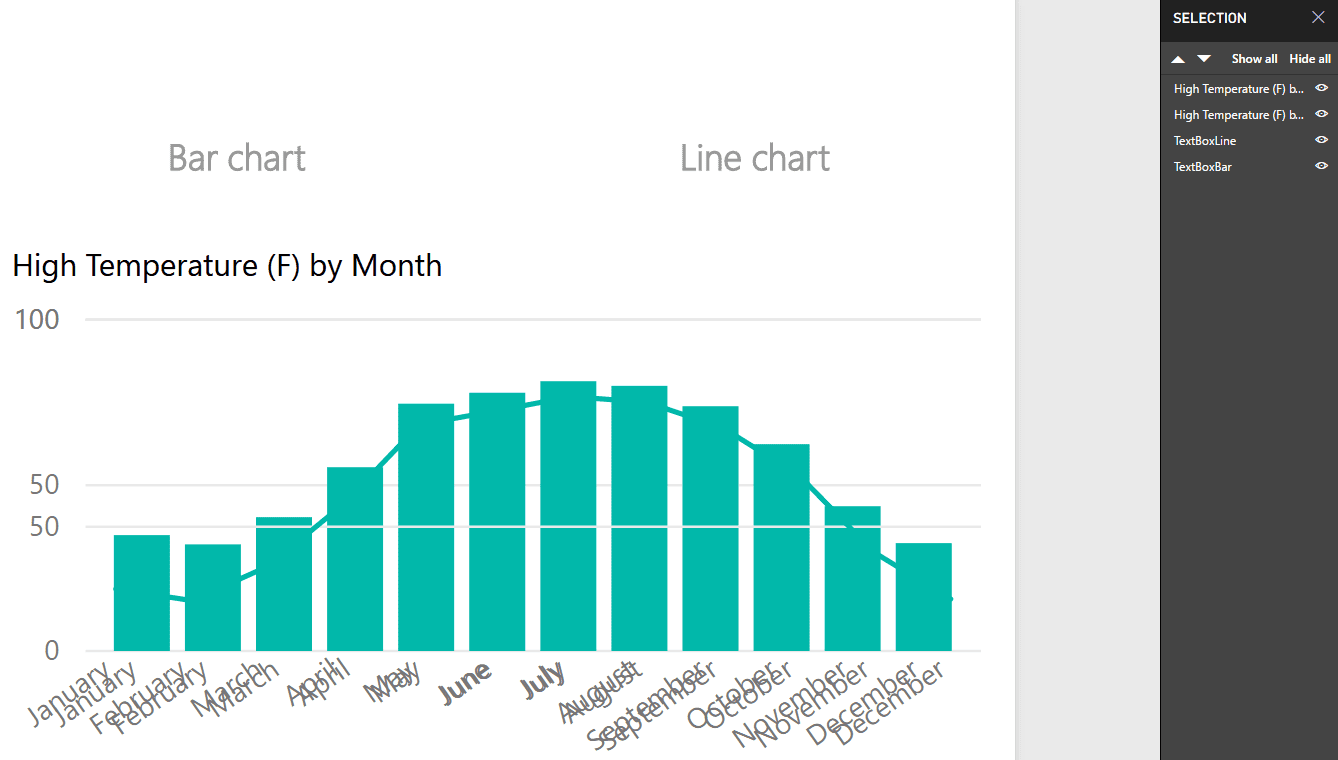
When the Power BI team released the hotly anticipated Bookmarks functionality in October, users were quickly drawn to the brilliant method of using bookmarks to toggle between two visuals. This concept was demonstrated in a Guy in a Cube video and in the Power BI Desktop Update October 2017 release video.

The basic idea is that the report author overlays two images. Each image has a link to a separate bookmark. When clicked, the “button” appears to toggle back and forth between content as various visuals are shown or hidden in a bookmark. For example, the author might create a bookmark for a bar chart and a separate bookmark for a line chart, and then add images linked to the bookmarks to move between them. With proper planning, using images to toggle between two options works well.
What if the author decides to make changes or add other options after putting bookmarks in — perhaps a third visual with another chart type? One of the main disadvantages of using Power BI’s built-in Image functionality to toggle is that the images are static. More user interactions in the future create additional work outside of Power BI, both to find or edit images and then to replace the existing ones in the report. In addition, any time the author adds a new object to the report, they must update all affected bookmarks. As advantageous as bookmarks are to the Power BI storytelling experience, you can see why they require forethought and planning to avoid rework.
HTML to the Rescue!
An alternate method to using static images is to use Power BI’s built-in Shapes. Like images, Power BI allows shapes to link to bookmarks. In this case, transparent shapes are overlaid above a single HTML Viewer custom visual that contains the toggle image. The HTML Viewer accepts a column from the data model as input, so the toggle source is data-driven instead of static. Images or icons can be easily swapped out or added in a data source, rather than the report. If an existing report requires additional changes, this method cuts down (but does not eliminate) the number of editing steps.
How Does It Work?
Perhaps a user does not like the look or color of the toggle images and wants to change them. Using static images, this change requires adding the new images in the report and updating all of the bookmarks accordingly. With the HTML Viewer and data-driven images, however, you only need a quick data change and report refresh.
In summary, the following components are required to make the solution work:
- One HTML Viewer custom visual added through the Store
- Two or more transparent rectangle shapes with links to bookmarks
- Two or more primary visuals that function as toggle targets, e.g. column chart and line chart
Looking at it step by step, add the data to your report in Power BI Desktop, and then build and overlay the two visuals you want to toggle between.
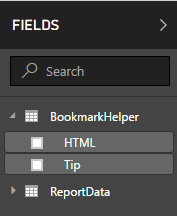
Add another data source containing the HTML data with two or more records you want to switch between. It may help to have an extra field for a label as well. This is a disconnected table with no relationship to the primary report data.

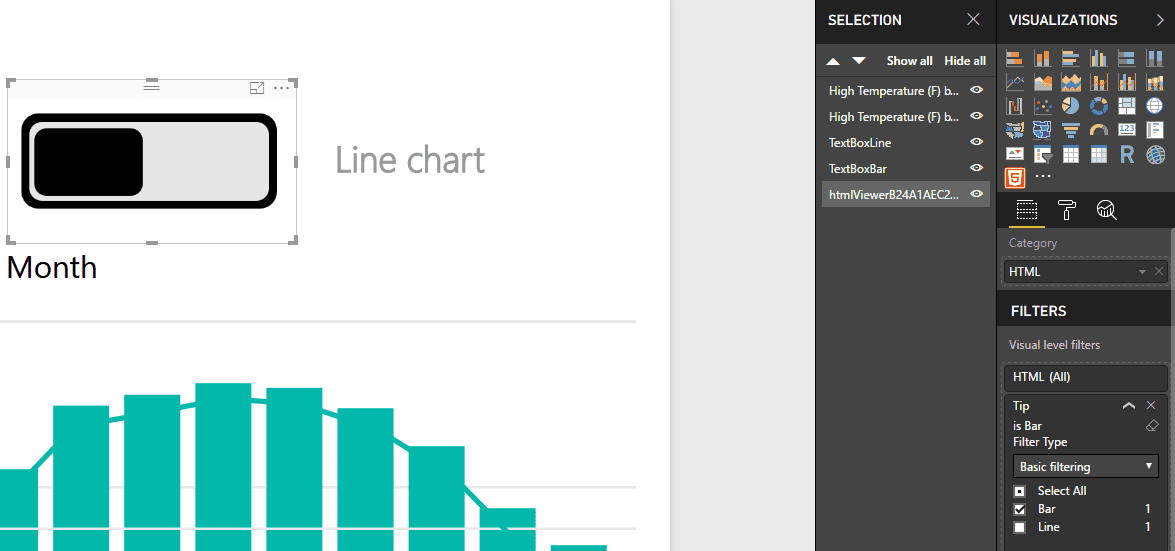
Obtain the HTML Viewer custom visual from the Store and add the HTML column to it. Note that when you add the data to the visual, all toggle images appear.
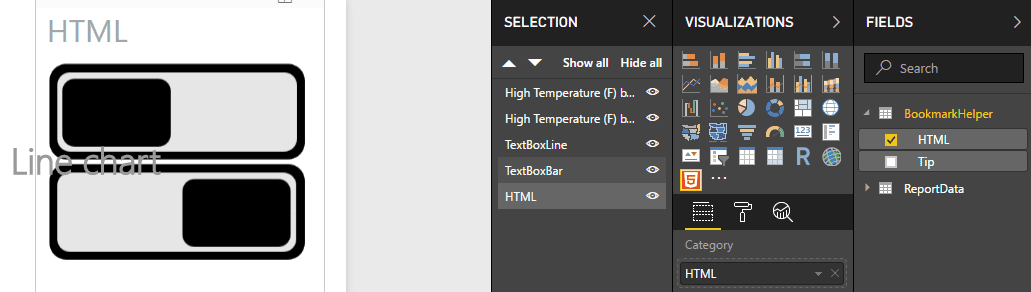
Add a Filter for the soon-to-be bookmarked image selection (Bar in the example). Position and resize the HTML Viewer visual as needed, and hide that visual’s Title.
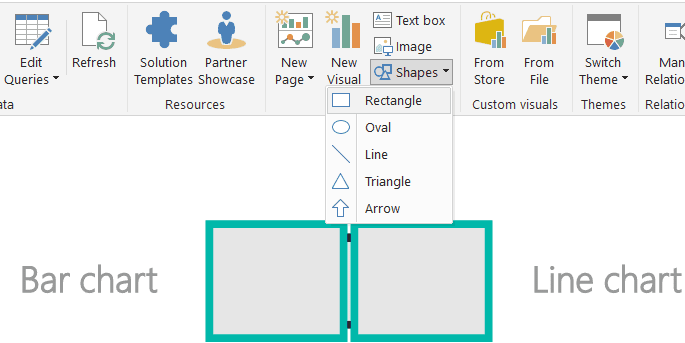
Add two rectangle shapes and position them next to each other on the toggle. Do not overlay them.
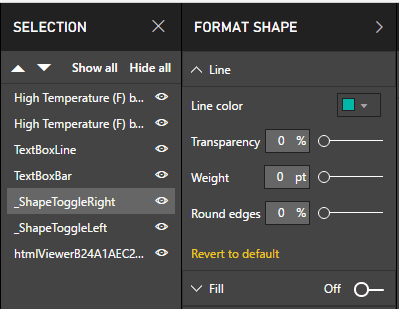
Make the two rectangle shapes transparent by switching Fill to Off and changing the Line Weight to 0pt in the Format Shape options.
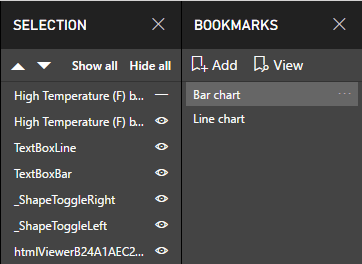
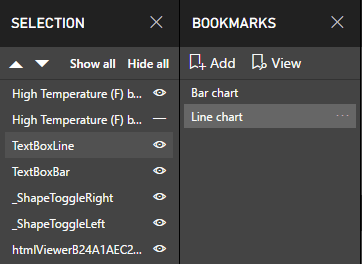
Hide the second visual (the line chart in this example) in the Selection pane and then make a bookmark. Hide the first visual and show the second visual in the Selection pane, and then make a second bookmark. Since the shapes were not overlaid, there is no need to hide any of the other supporting objects.
 |
 |
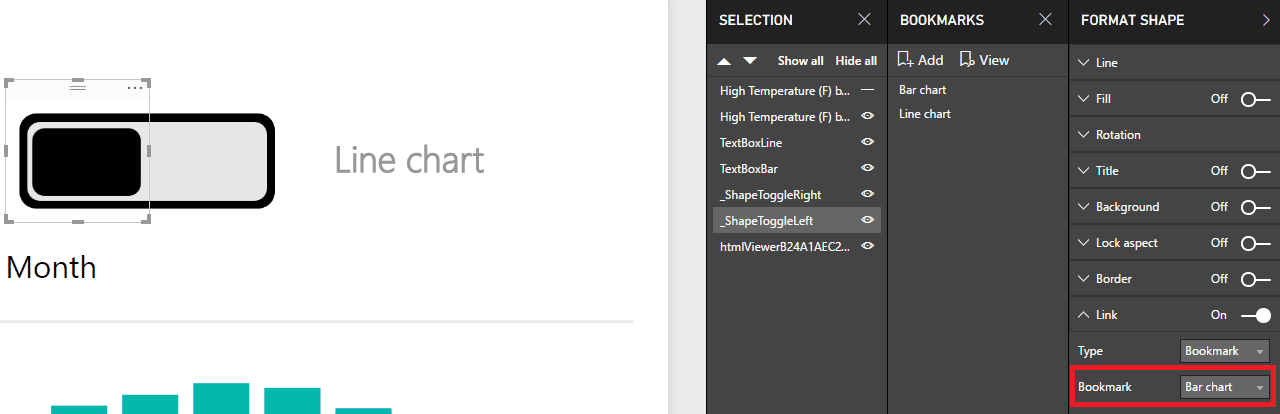
Click on the left shape and add a Link to the first bookmark. Then, click on the right shape and add a Link to the second bookmark. This creates the toggle effect when you click on the “off” side of the image once you publish the report to Power BI Service.

If you then update your HTML image source URLs and refresh your Power BI report, there is no additional work needed to alter the two images.

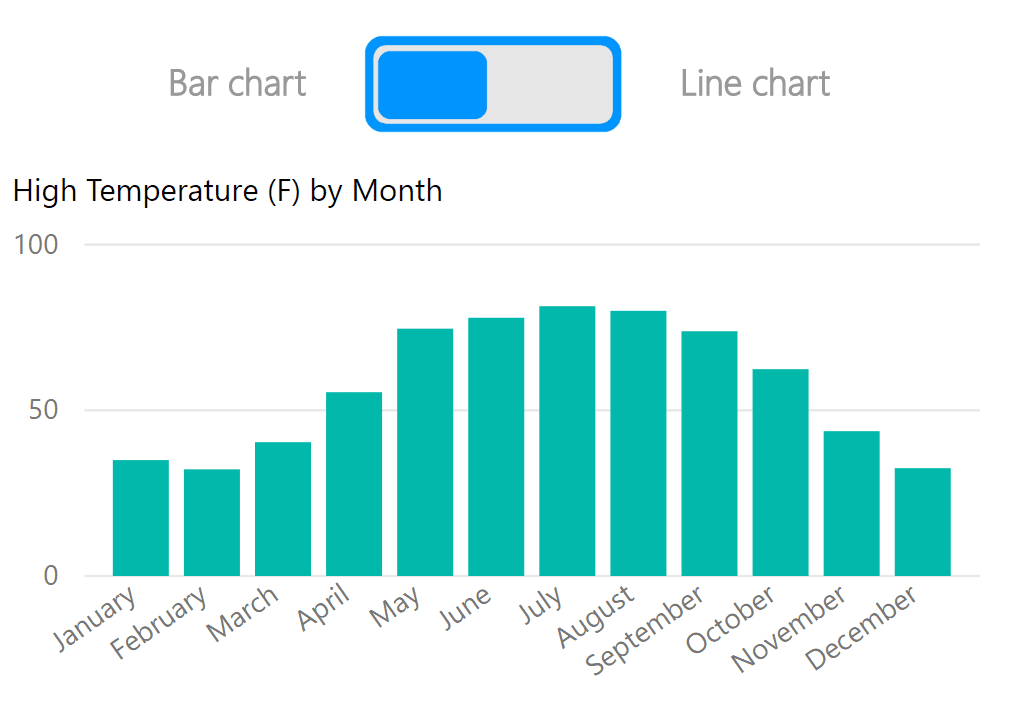
Publish to the Power BI Service and see your bookmarks in action!
You can also more easily extend beyond the limitation of a two-image toggle using this method as well. In the following example, three transparent shapes overlay a single HTML Viewer set of icons. You can add as many selections as needed! Note how the color changes so that the currently selected visual is grayed out. Follow BlueGranite on Twitter @BlueGraniteInc and let us know if you would like the sample PBIX file!
As with many things in Power BI, there are multiple ways to accomplish a goal. While the existing image toggle works well, it may sometimes be beneficial to extend the functionality using the more dynamic method outlined above. When creating bookmarks, content authors now have one more tool in their toolkit to help users navigate through a data story.


