
In October of this year, Power BI introduced an exciting new preview feature: bookmarks. Bookmarks, and the selection pane introduced alongside them, provide a solution to what was previously one of Power BI’s biggest pain points: the inability to configure and save specific, individualized views of report pages. Now, views of pages configured by slicers, filters, sort directions, and the new show or hide options in the selection pane can easily be saved as bookmarks.
Before we get started, I recommend checking out the Power BI report highlighted throughout this post online using Power BI Service, or trying the embedded version below. When a report like this one is viewed online, especially in full screen mode (using the bottom right corner), it becomes an immersive, intuitive, app-like experience.
Note: Since bookmarking is still in beta, bookmarks cannot be created in the service, but they can be used there. Bookmarks in Power BI differ from those in Tableau in both behavior and general use. In Tableau, bookmarks are copies of configured pages that can be imported and exported from workbook to workbook. Unlike Power BI, if the original changes, for example by having a new measure or chart added to it, the bookmark will not reflect that change. Once a bookmark is created, it is no longer linked the original. In Power BI, the two are linked, and live in the same report, so any change to the original is reflected in the bookmark and vice versa. We’ll explore this functionality, its advantages, and its uses further below.
These new features not only deliver some of the most requested functionality in Power BI, but also give developers new ways to produce creative and interactive reports. Bookmarked pages and the selection pane (which gives developers the ability to show or hide visualizations; see Figures 1c and 3b below) open the door for developers to create Power BI reports that are app-like in nature. This blog post will showcase a basic example of how to create a report that looks and feels more like an app.
Before diving into development, bookmarks need to be enabled in Power BI Desktop. To enable bookmarks (or any preview feature), navigate to “Preview Features” in the Options dialog box. Check the box next to “Bookmarks.” You will be prompted to restart Power BI Desktop to finish the process.
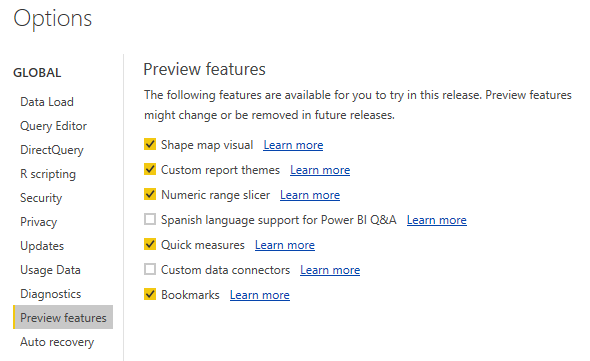 Figure 1a
Once Power BI Desktop restarts, you can utilize bookmarks and the selection pane by selecting them in the View ribbon at the top of the screen.
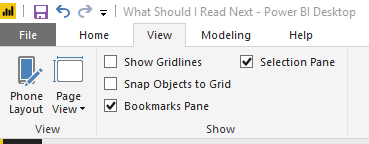 Figure 1b
You will now see the Selection pane and Bookmarks pane to the right, next to the Visualizations and Fields panes that you’re used to.
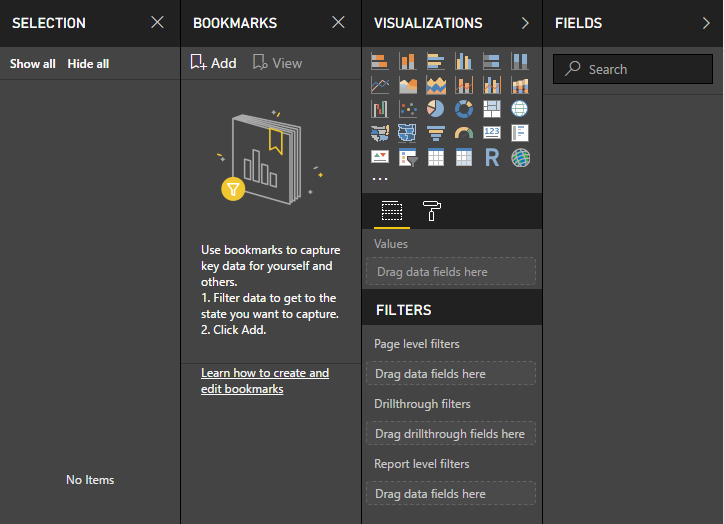 Figure 1c
Maybe it was word association with “bookmarks”, or the fact that people frequently ask me for book recommendations, but for this example, I created “What Should I Read Next,” a Power BI report designed to guide readers through the process of picking their next book. Using data from Goodreads.com and HowLongToReadThis.com, simple visualizations, and the new bookmarks and selection features, I created a report that behaves, looks, and feels more like a custom application than a standard Power BI report. A link to this report is available toward the end of this post.
The report has four main components that interact via bookmarks: the welcome page, the library page, a table view page, and individual book pages. For the sake of brevity, I’m not going to go into detail on how I developed every part of the report, I’m only going to cover the portions that relate to the new features, bookmarking and the selection pane, and how I achieved the app-like look and feel.
The first screen users see is a welcome page, much like you would see in any application. I added text to give users direction, created “buttons” by combining text with simple, empty rectangle shapes, and added a clipart image of books.
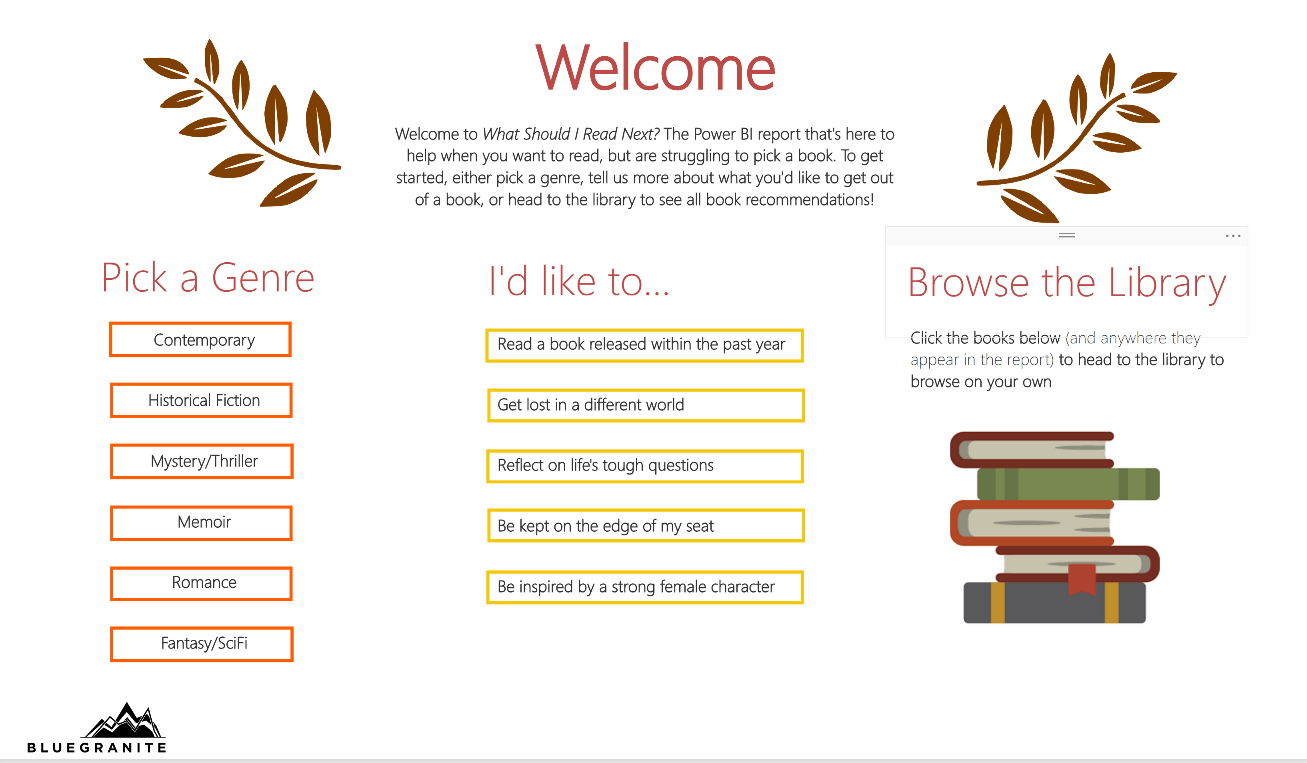
Figure 2a
Users can click any of the buttons or the books to navigate to different, bookmarked versions of the library page:
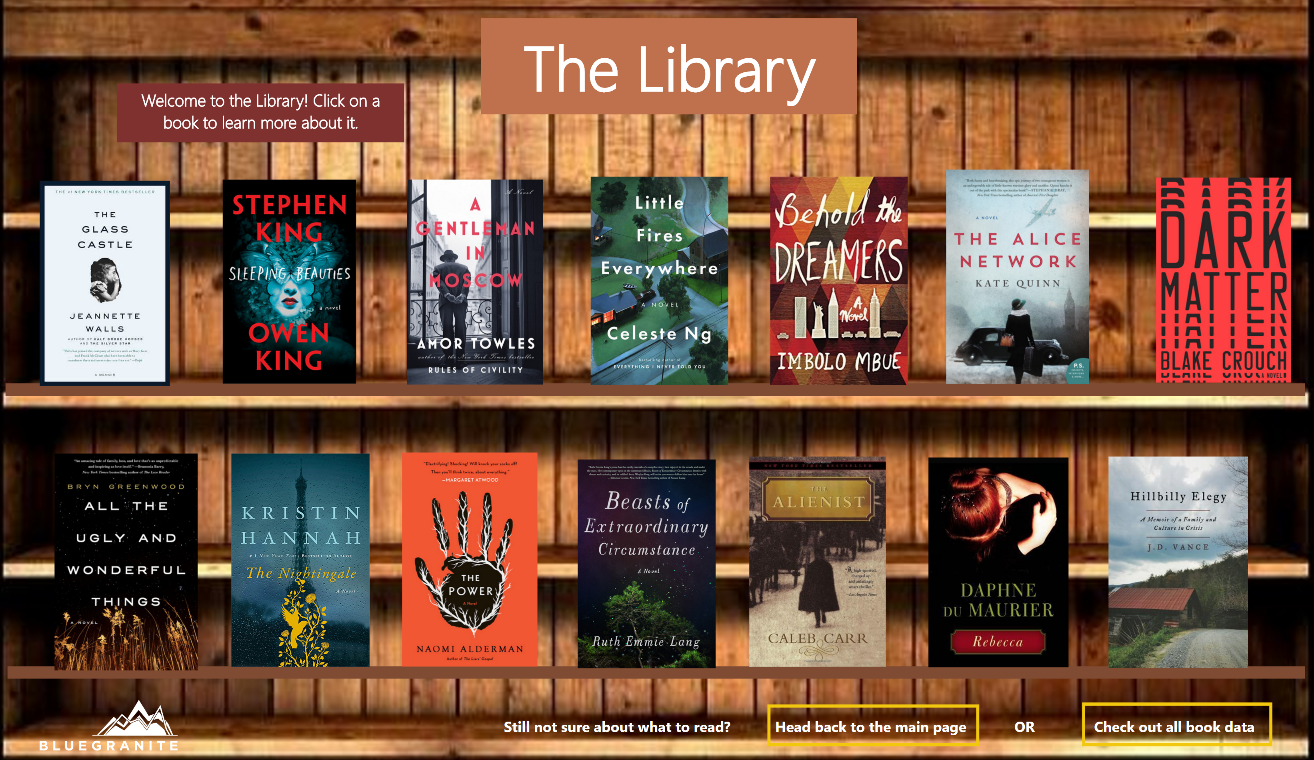
Figure 2b
The library page is like the welcome page in that it uses images and shapes to link to other bookmarked report pages. When clicked, each book in the library will take users to a page for that book, complete with a synopsis, rating, food and drink pairing, external links, and a link back to the library page:
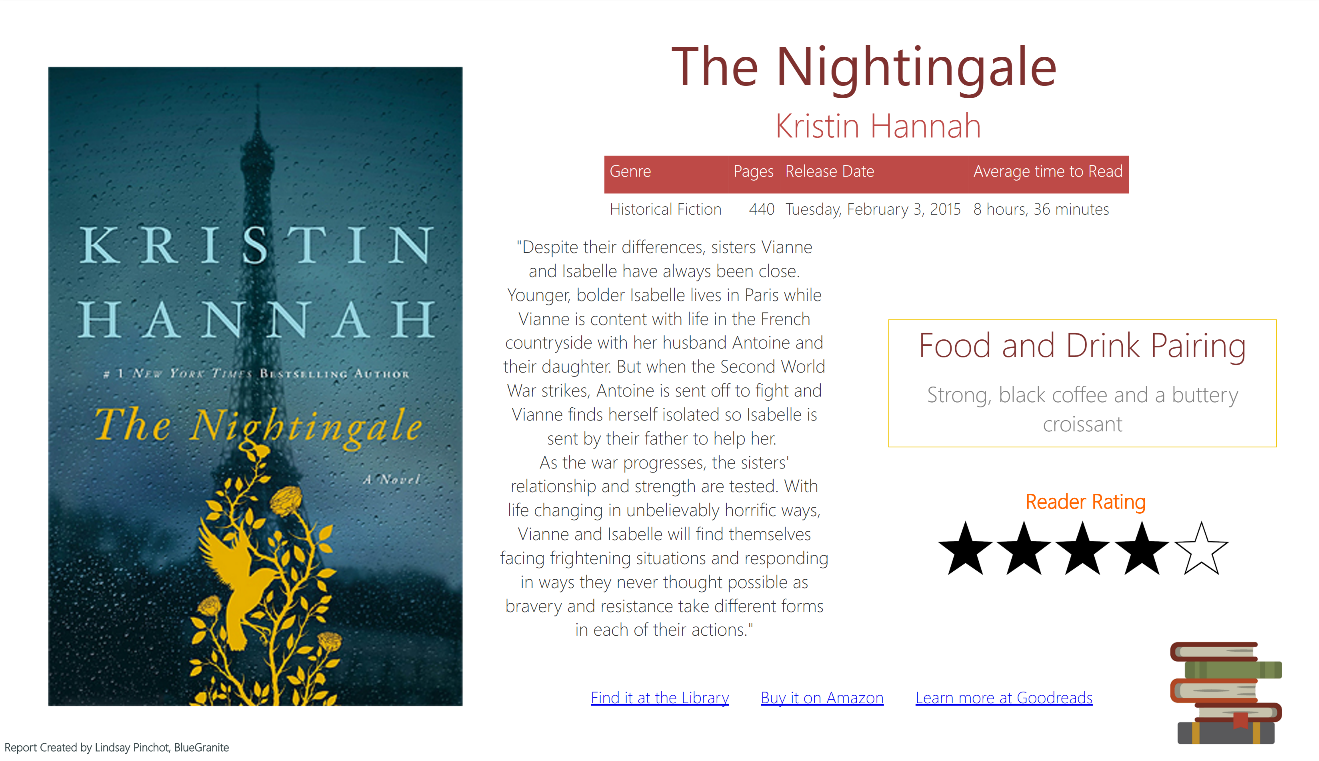
Figure 2c
The library page also has buttons at the bottom that will take users back to either the welcome page, or to a page with all the book data in a table:
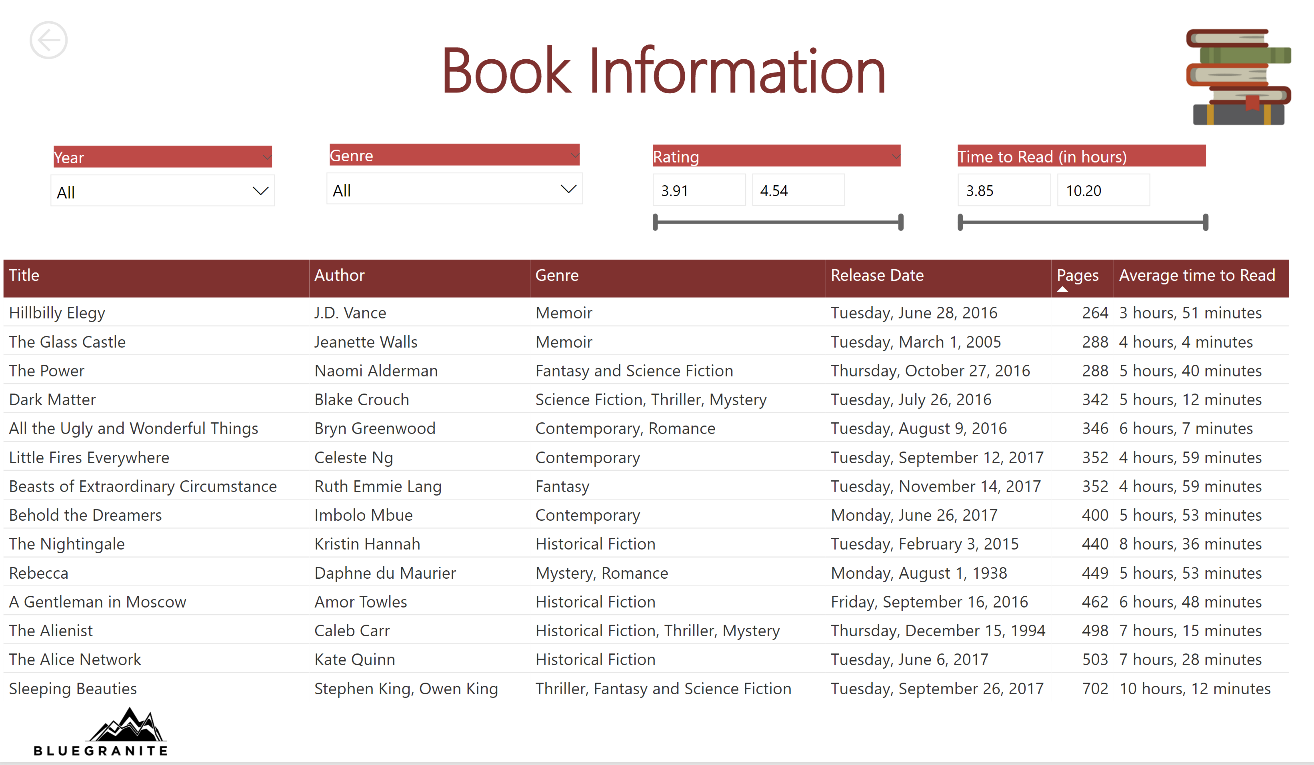
Figure 2d
This page is bookmarked to appear sorted by number of pages. It also has the stacked book image that appears throughout this report, and when clicked, takes users back to the library.
So how do you set up bookmarks to create this type of report navigation? Easy!
To demonstrate, let’s walk through the creation of the historical fiction bookmark together. When I click, “Historical Fiction” on the welcome page, it takes me to this bookmarked view of the library page (the original version is shown in Figure 2b).
Note: When developing in desktop, you need to hold down ctrl + click to have your linked images behave like links. Once published to the service, users can simply click.
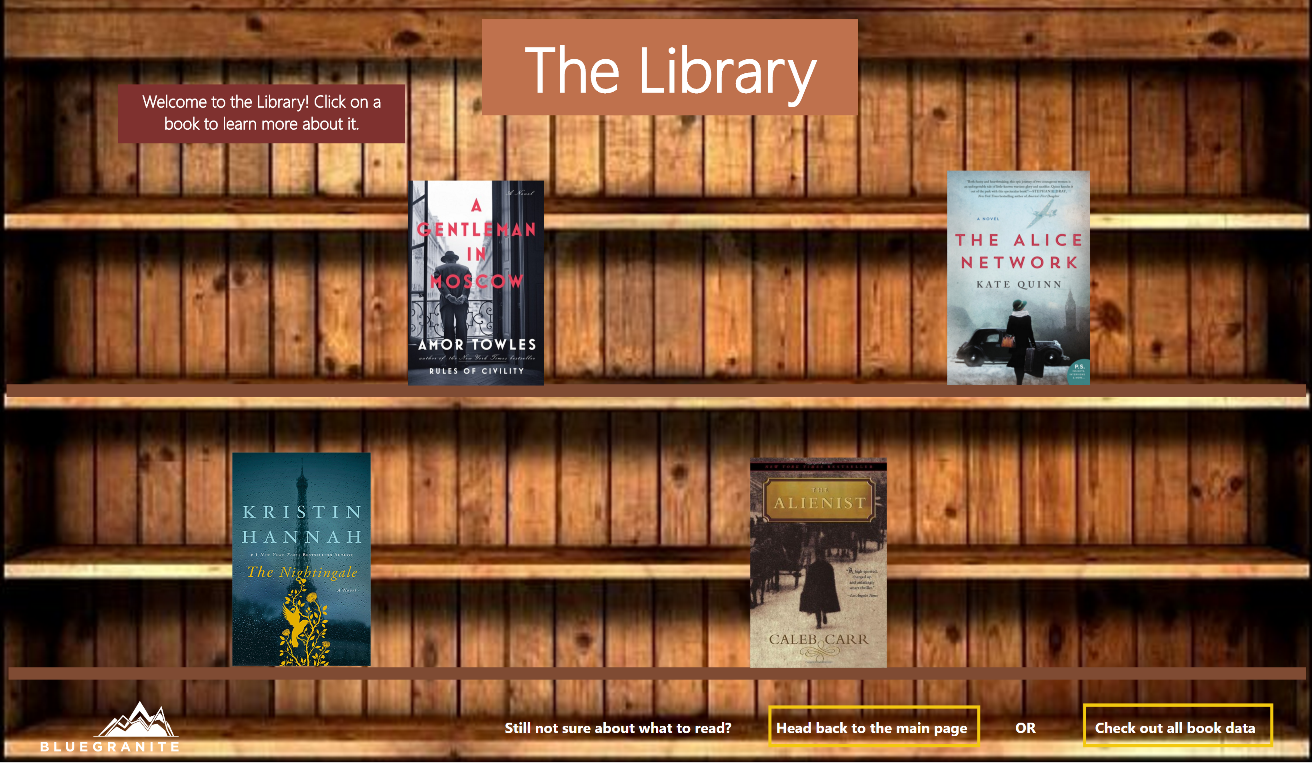
Figure 3a
I created this view by hiding all the books not in the historical fiction genre. To show or hide a visualization (in this case, an image), simply click the eye icon next to it in the “Selection Pane”. When the eye is clicked, it toggles to a dash, and the image is now hidden on the page.
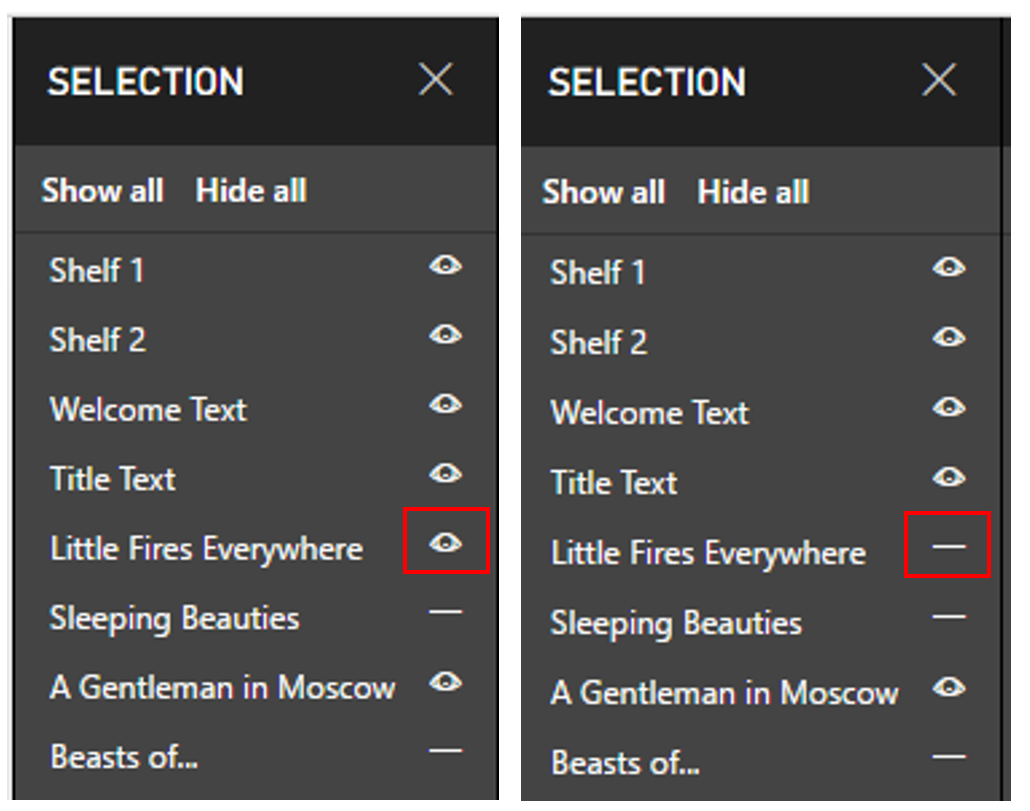 Figure 3b
Note: When you first put an image, shape, or text box on the report, it will be given a generic name in the selection pane. To give it a unique name, enable the image title in the format pane, name it, and then disable it again. Now the title doesn’t show above the image in the actual report, but it does show in the selection pane, making your report development just a little easier.
Once I had the view of the library that I wanted, I saved it as a bookmark, by clicking “Add” in the bookmarks pane. By default, it was named “Bookmark”, so I renamed it to something more meaningful, in this case, “Historical Fiction”.
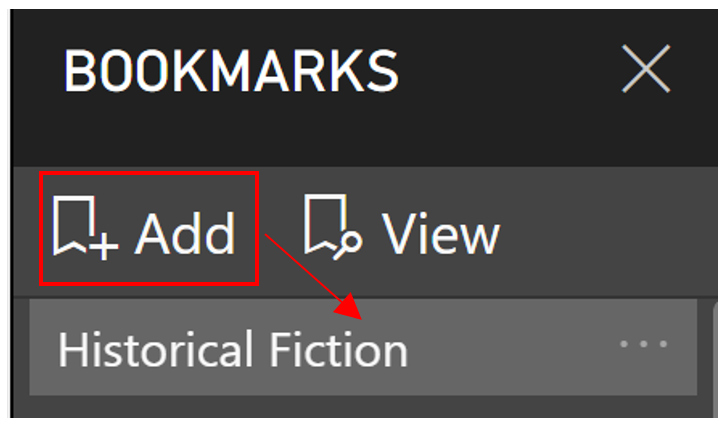 Figure 3c
Note: You can rename, update, or delete a bookmark at any point by clicking the ellipsis next to it.
With the historical fiction bookmark created, I returned to the welcome page to add a link to it there. I selected the visualization that I wanted to point to it (the rectangle around the “Historical Fiction” text, not the text itself), and formatted it to be a link:
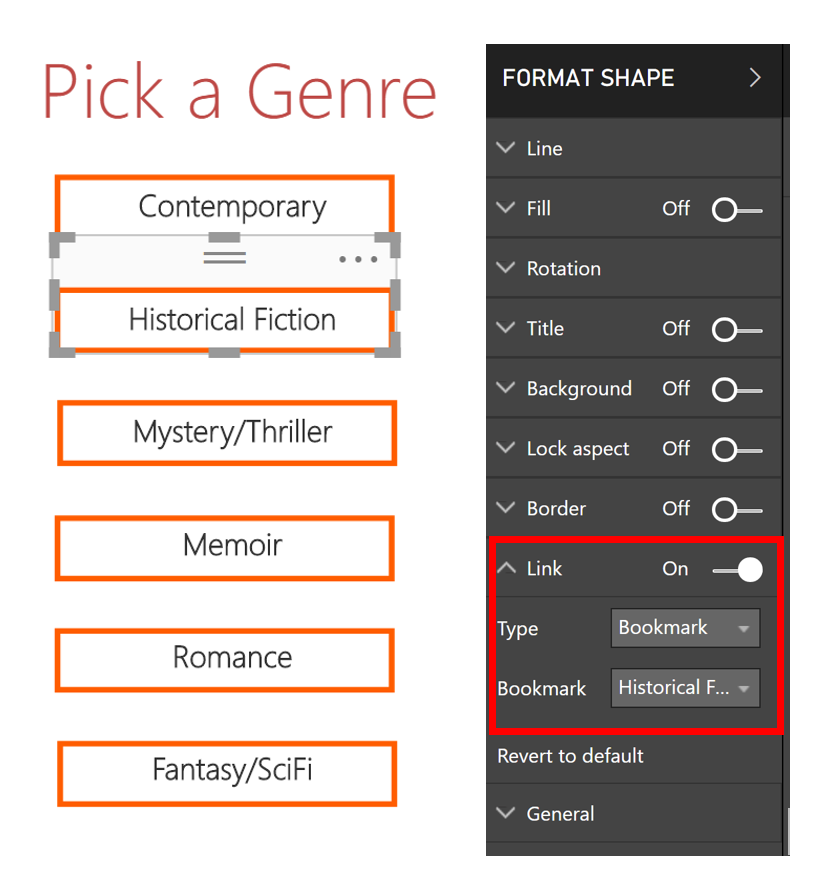 Figure 3d
In the format pane, I turned the “Link” toggle to on, changed the type from “Back” to “Bookmark” and then selected “Historical Fiction” from the bookmark drop down menu. Now, when users hover over that rectangle, a hand appears, indicating that they can click and follow it to a new page.
From here, I repeated this process for every view of the report pages I needed to make my “app” function the way I wanted it to. I added bookmarks for the welcome page, each different view of the library page based on the various selection options, one for each book page, and one for the sorted table page. By the time I was done, I had a long list of bookmarks:
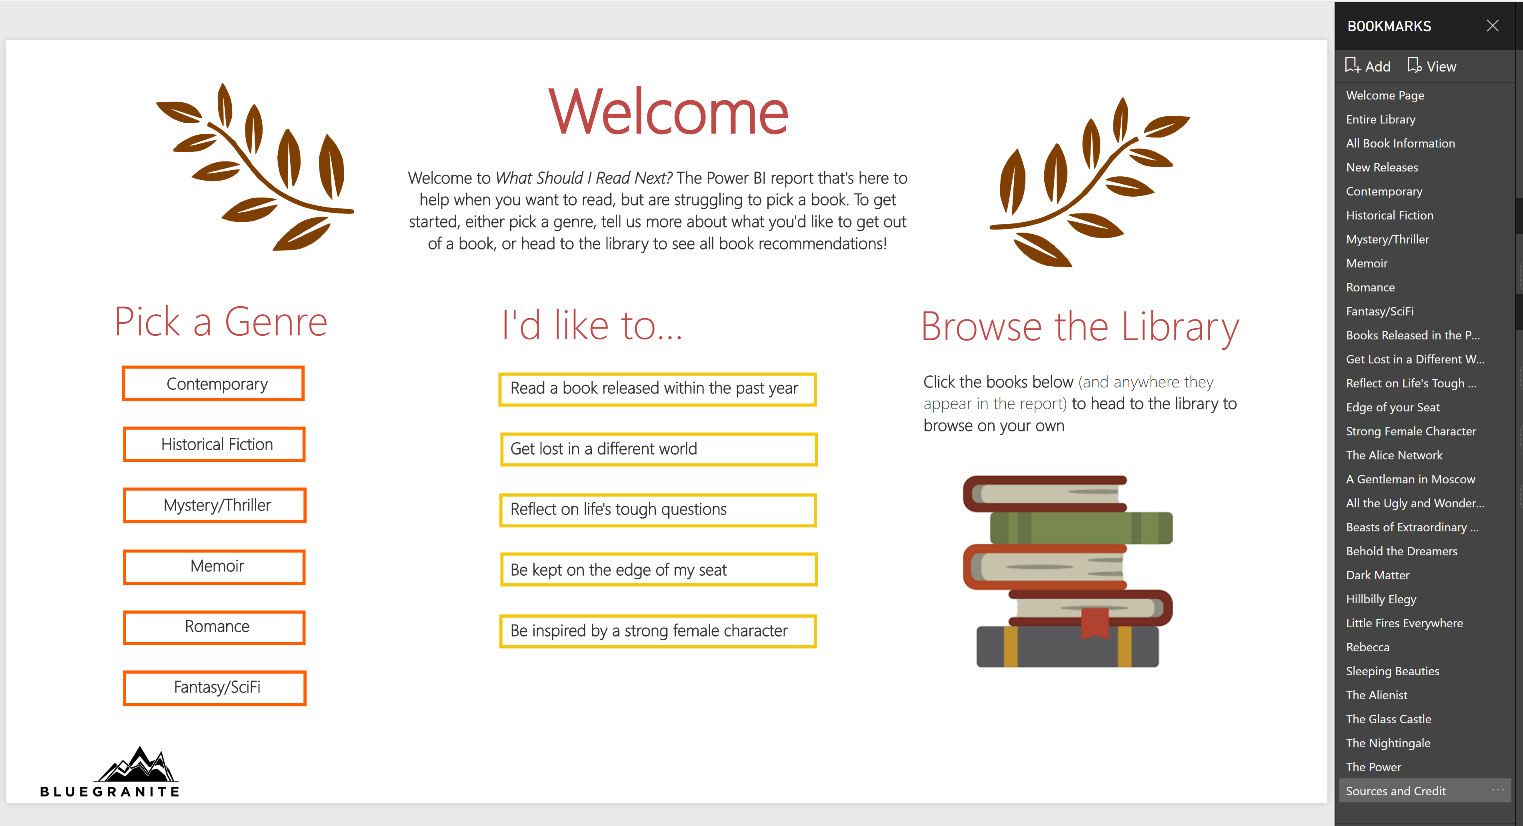
Figure 3e
Although it looks like a lot, it wasn’t much work once I had the main pages developed. It was simply a matter of displaying and hiding visualizations, sorting and filtering data, saving off different bookmarks, and creating links to them. It’s simple development that creates a next-level, interactive report for users. At any point while exploring “What Should I Read Next”, the user can swiftly and intelligently navigate between pages to find exactly what she’s looking for.
After publishing a report with bookmarks to the service, simply enable bookmarking and the selection pane under View in the top ribbon:
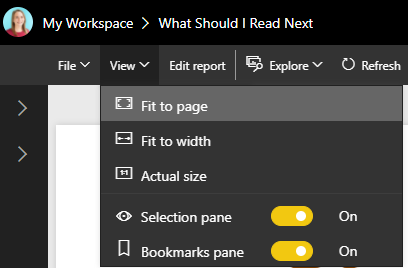 Figure 4a
Bookmarks have many applications. They’re ideal for creating business presentations, tailoring reports to individual users or specific datasets, and creating reporting experiences like the one demonstrated in this post. With the introduction of bookmarks and the selection pane coming hot on the heels of drillthrough in September, Power BI is more dynamic than ever. To learn more about bookmarking, the selection pane, and other enhancements to Power BI, check out Microsoft’s Power BI Blog, or contact us here at BlueGranite. We’re happy to work with you and your organization to help you get the most out of your data.
Sources:
https://powerbi.microsoft.com/en-us/blog/power-bi-desktop-october-2017-feature-summary/
https://www.goodreads.com/
https://www.amazon.com/
https://www.howlongtoreadthis.com/
http://www.columbuslibrary.org/


