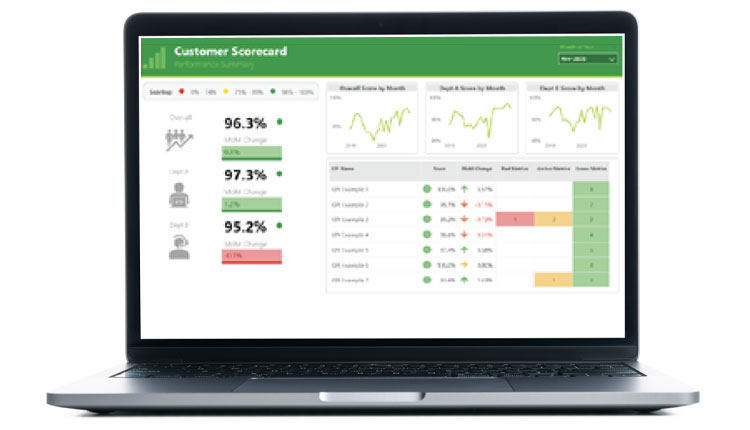

Today’s competitive landscape requires organizations to transform valuable data into tangible business outcomes. They must strike a balance between empowering business units with self-service data and analytics capabilities and maintaining security and governance to enable applications, reports, and dashboards in real-time. Modern business intelligence means using data to see the future, achieve greater agility, meet growing business demands, and adapt to industry changes, and must achieve these goals while doing more with less.
Enterprise Analytics allow businesses to efficiently manage a set of standardized or regulated reporting and data needs while also enabling deeper insights by embedding AI and Machine Learning into the process. Augmenting traditional reporting with predictive and prescriptive analytics provides additional insights beyond historical records by predicting future values and organizing the data so you focus on what’s important, and what to do about it.
When done right, powerful reports and dashboards should tell a unified and impactful story. 3Cloud’s data visualization experts will work with your team to uncover your analytics use-case inventory, understand data consumer needs, and establish standards and best practices for effective data solutions. Our experts develop custom reports and dashboards that help develop and deploy customized visualization templates and themes designed to enable your organization to communicate effectively with data.
Self-service adoption is one of the most challenging capabilities for organizations to establish. Our experts will partner with your employees at all data proficiency levels to ensure the platform works for them, from managing data access and security all the way to ensuring consumers can translate data into valuable insights. 3Cloud’s broad capabilities can focus on the end-user experience and ensure that both technical and non-technical leaders receive the benefits of an agile, self-service platform without the risks to governance, performance, and sprawl.

3Cloud’s solution
3Cloud’s Modern Business Intelligence Jumpstart is the first step in implementing a successful self-service business intelligence program. Self-service adoption is one of the most challenging capabilities for organizations to establish.
Our experts will partner with your employees at all data proficiency levels to ensure the platform works for them, from managing data access and security all the way to ensuring consumers can translate data into valuable insights.
Enable Users at All Levels of the Organization. IT organizations can reduce the amount of time spent managing reporting needs by driving a data culture and balancing self-service analytics with enterprise-managed reporting. Deliver more cost effective and robust business intelligence solutions on Power BI while increasing overall security and compliance through managed processes.
Speed and Agility. Drive user satisfaction and a consistent experience through a modern platform using Microsoft Power BI and Azure. Expert deployment enables the business to spend less time wrangling data and more time analyzing information, speeding time to insights.
Actionable Insight. Modern Business Intelligence Jumpstart enables your analysts and savvy business users to take BI beyond traditional slice-and-dice with new machine learning and AI capabilities within Microsoft Azure and Power BI.
3Cloud’s Modern Business Intelligence Jumpstart is built to accelerate the adoption of Power BI across the enterprise while serving both IT users for monitoring and business users with self- service.

“This is the insight into a lot of data that we’ve been struggling to make business decisions around easily. Your (3Cloud) insight has helped us set up an environment that is solid going forward, and we won’t look back wishing we would’ve done something different. Your expertise has been awesome!”