
Anyone who took a statistics course in college likely heard the oft-repeated phrase “correlation doesn’t equal causation”. We may have fully embraced this mantra after graduation, but in business, it can be difficult to assess whether two real-world items share a causal relationship or are merely correlated. Treating correlation as if it is causation can have comical or catastrophic implications for an organization. In this article, I discuss how an event study may be the solution to determine once and for all if A causes B.

About Causal Analysis
There are many, complicated ways to conduct a causal analysis; however, an event study is particularly well suited for a tool like Microsoft’s Power BI. Similar business intelligence software are better known for describing what happened through visualizations rather than why something happened. I have written about the AI features in Power BI before, but even visuals like Key Influencers and AutoML use pattern recognition instead of identifying a causal pathway. The solution, therefore, is to create an event study.
For Example
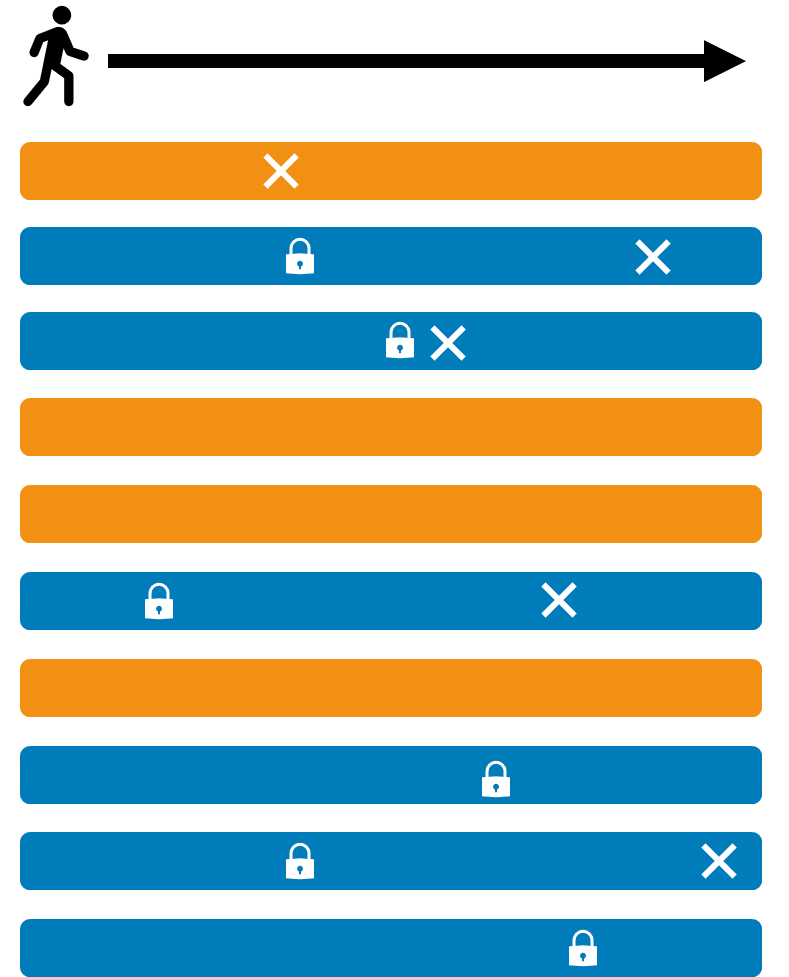
To understand the way an event study works, let me describe how it can be applied to a specific business problem. Imagine there is a bank wanting to understand how customers respond to having valid credit card transactions declined for suspicion of fraud. Consider the figure to the right where each row represents a different bank customer over time. Some customers have a transaction declined by the bank (occurring at the “X” mark) and some customers close their account (occurring at the lock icon). The question is how to determine if transaction declines cause account closures or whether the two are merely correlated.
The Traditional Approach
A traditional analysis in Power BI would compare the daily number of account declines against account closures. This could result in a spurious correlation, such as a growing company that concurrently experiences an increase in declines, as well as an increase in account closures due to there simply being more users overall. Ultimately, there is a loss of information when aggregating to the calendar date level, where we do not know if those with declines are the same customers as those closing their accounts.
Why an Event Study?
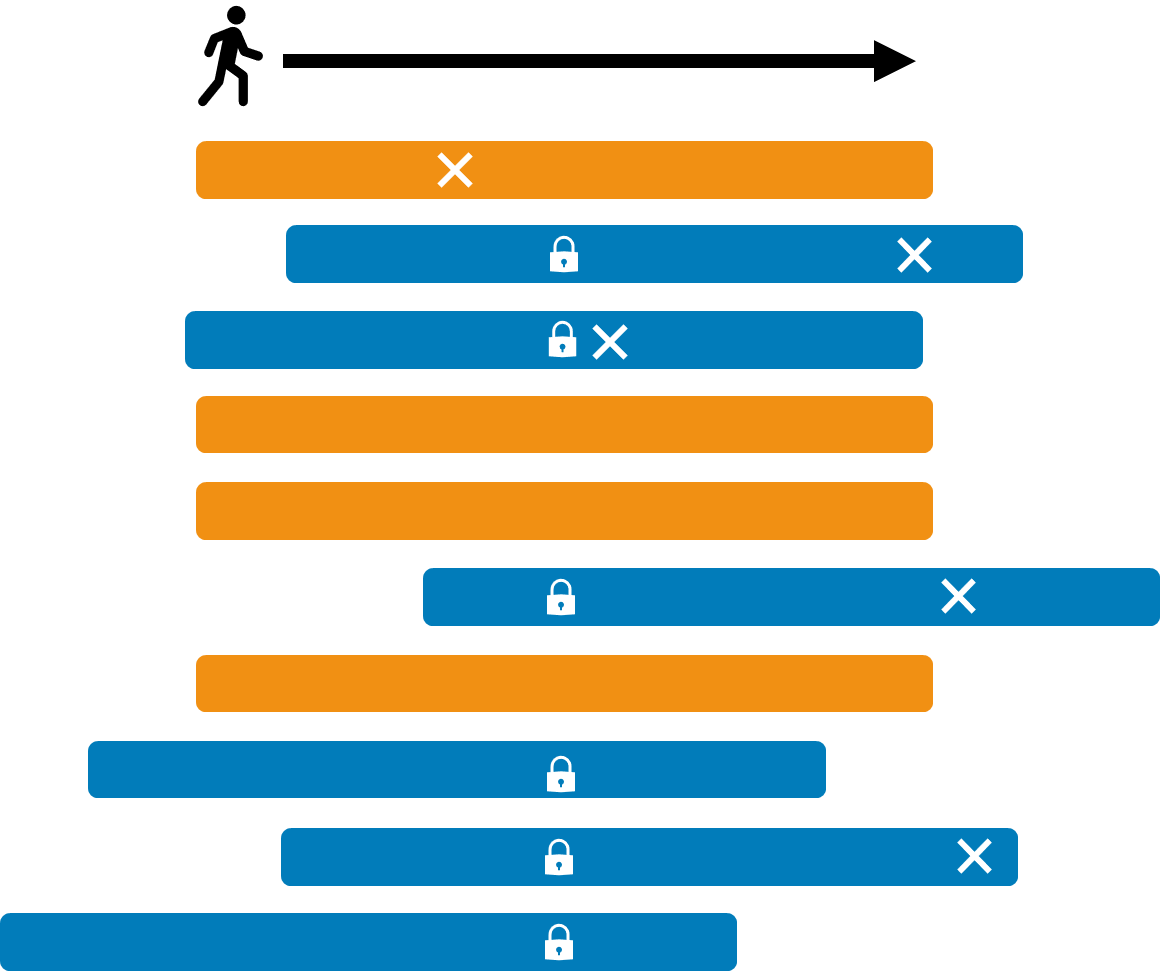
An event study, on the other hand, considers what if all events happened on the same day. This is visualized in the figure to the left where the time series for customers who closed their accounts (denoted in blue) are aligned on the date of the closure. And the customers who did not close their accounts (in orange) are not aligned but may still have had a declined transaction. This allows us to make two critical comparisons: “Are those who experience declines more likely to close an account?” and “Is customer behavior before a transaction decline different than behavior after a decline?”. Between these we can identify if one event causes the other, and if so, estimate the size of the effect.
The Solution
The result looks similar to the below figure, where Day 0 represents when a declined transaction occurs for the blue customers, or an accepted transaction occurs for the orange customers. The horizontal time axis represents the number of positive or negative days from Day 0 while the vertical axis shows the number of account closures each day for the two groups.
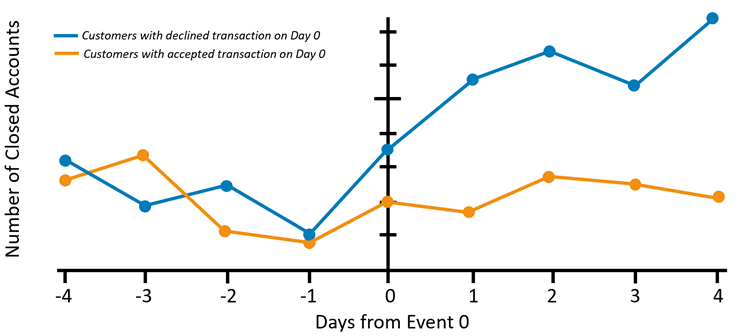
We can easily see from the event study how an accepted transaction for the orange customers does not lead to a meaningful change in account closures following Event 0, while a declined transaction for the blue customers is associated with increased account closures for the blue customers. This is consistent with a causal effect that declined transactions do in fact lead customers to close their bank account.
Optional Improvements
There are additional specifications and expansions to the model that can improve the modeling. First, is to ensure there are no confounding factors in the sample groups. In this example, it is important that the orange group does not include customers who had declined transactions close to Event 0. Additionally, the blue group could be decomposed into different groups according to the number of declines that had to see if cumulative declines have a larger effect than a single instance. The event study could also be expanded to measure different outcomes, such as the number (or value) of transactions each day, the daily percent of accounts used, or the number of days since the last transaction.
In Conclusion
Event studies are a relatively common form of causal analysis within the fields of finance, economics, and marketing. If you ever need to understand the relationship between two events in a way that is easy to understand and visually appealing, then I strongly recommend using an event study for your next Power BI report.
3Cloud offers a variety of resources to help you learn how you can best leverage Modern Data Analytics to meet your business needs.
If it sounds like your business could benefit from causal event study services in order to reach your goals with your modern analytics initiatives, contact us directly to see how we can help you explore your options and accelerate your business value.


