
Power BI Report Server (PBIRS) is a superset of SQL Server Reporting Services (SSRS), itself a mature BI technology that has been a key component of the Microsoft BI stack for 15+ years. The main difference between the two platforms is that PBIRS brings with it Power BI reports, providing a modern BI experience to on-premises implementations.
As is the case with any enterprise BI product, careful planning and consideration of how the technology will be leveraged should be made up-front. This will help avoid speed bumps during implementation and ensure a smooth ride as you roll out your BI and analytics solutions. Whether you’ve been working with PBIRS from day one, or are starting to use the platform for the first time, the goal of this post is to showcase tips and techniques that you can turn around and apply in your own environment.
Additionally, for those of you considering a hybrid Power BI implementation (Power BI service and Power BI Report Server), we will compare specific features of each platform below.
This post will cover five specific tips. The topics are listed chronologically based on how a typical implementation normally proceeds.
- Configure Your Report Server
- Understand, Plan, and Implement Folder Level Security
- Leverage Analysis Services for Reusability
- Simplify Administration Using PowerShell
- Monitor Your Report Server
Configure Your Report Server
After installing your report server, you should consider reviewing some of the default configurations. We’re not referring to configurations found in the Reporting Services Configuration Manager, but rather the advanced properties you can tweak from within SQL Server Management Studio (SSMS). For many implementations, the default values of these properties will be fine. However, there may be some specific use cases for when you would want to change a setting. The advanced properties in PBIRS are akin to Power BI Service’s tenant settings in the Admin portal.
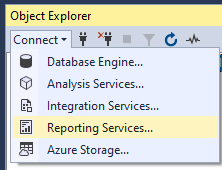
First, to view the advanced properties dialog, you need to connect to your report server from SSMS.
- From Object Explorer select Reporting Services.

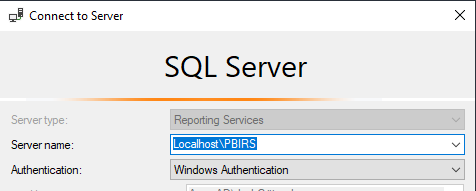
- Enter your credentials to connect to your report server.

- Right-click on your instance name and select Properties.
- The Server Properties dialog box will appear; select Advanced on the left-hand pane.


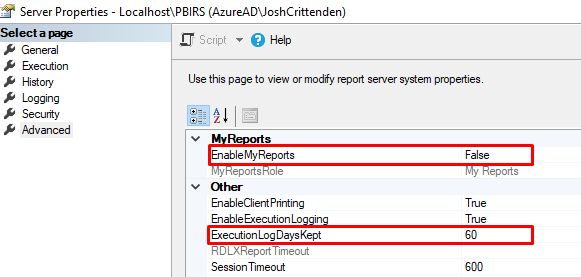
From the advanced properties menu you’ll notice a whole host of options you can toggle. Below are three specific properties that we have modified for some of our customers’ implementations.
- EnableMyReports
This setting is disabled by default, but many organizations prefer to enable this. The feature will provide every report server user with their own dedicated folder on the report server. This is similar to the My Workspace concept that users have within Power BI service. Enabling My Reports is a great way to encourage self-service BI.
- ExecutionLogDaysKept
This setting allows you to toggle how many days of report execution history are stored in the underlying ReportServer database. The default is 60 days. Increasing this value will collect more metadata, thus allowing you to analyze adoption over time. We talk about how you can monitor your report server in tip #No. 5.
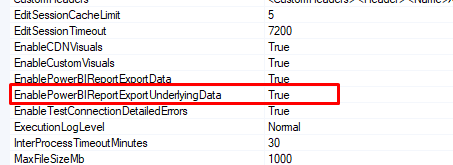
- EnablePowerBIReportExportUnderlyingData
This setting tells PBIRS what level of detail users can export data from a visual. In our experience, exporting underlying data can lead to major performance bottlenecks if you’re not careful. This is especially true if the underlying model is large (both in terms of data and attributes/measures). For this reason, we encourage customers to disable this setting. Most of the time users will simply be happy to export the raw data that they see within the visual they are exporting from.
Understand, Plan, and Implement Folder Level Security
When it comes to storing content like Power BI and paginated reports, Power BI Report Server and Power BI service are very different. Within Power BI service, we have the concept of App Workspaces and Apps. App Workspaces serve as collaborative sandboxes for teams to develop Power BI content in unison. Apps can then be created to publish the content to a broader audience of read-only consumers. These concepts do not exist in Power BI Report Server. Instead, we can create (and secure) folders.
Folders within Power BI Report Server (and SSRS) conceptually behave like folders within a file system. Folder-Level Security can be applied to restrict access to all content within the folder. Also, much like a file system, a folder hierarchy can be created. This is different than the flattened nature of App Workspaces within Power BI service. However, whether you are hosting reports in the service or PBIRS, careful planning must be done up front to properly secure your content. Typically, it makes sense to create folders for different departments or subject areas (e.g. Financials, Marketing, Sales).
In PBIRS, you can also define security on individual items ((e.g. a single Power BI report), but we typically steer customers away from that practice. In larger, enterprise deployments, it is not uncommon to have hundreds of reports. Securing each one individually would be a nightmare to maintain. Thus, the primary reason we advocate creating subject-specific folders to secure multiple related reports for a subset of users. In most cases, we also advise customers to stick to a flattened folder-structure. This not only makes securing folders easier to maintain, but it also logically adheres to the flattened structure of App Workspaces in Power BI service. This could simplify lifting and shifting your PBIRS content to Power BI Service should you ever explore that option in the future. Lastly, it’s a best practice to use AD groups as opposed to individual AD accounts when granting access to your user base. Much like securing folders over individual items, leveraging AD groups significantly simplifies the maintenance of your implementation.
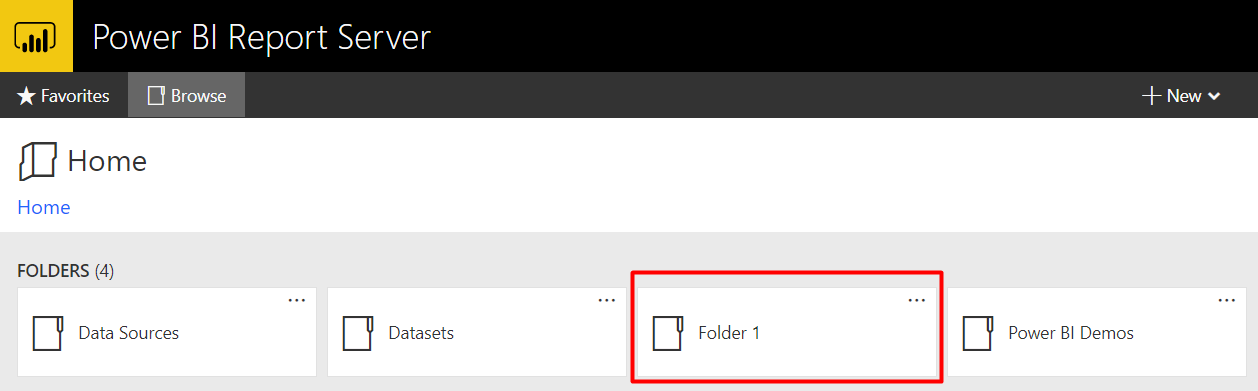
The root folder (Home) with four folders displayed.
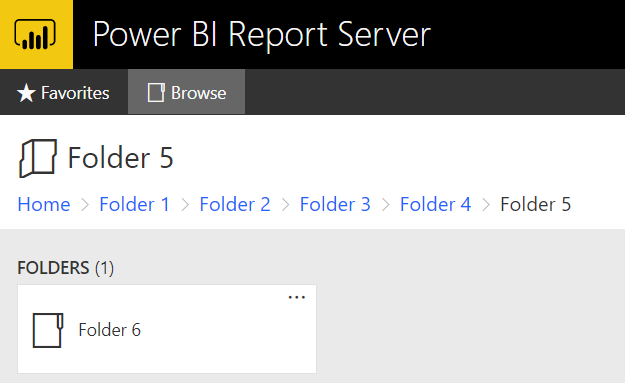
While it is possible to create a folder hierarchy, we typically advise customers to create a single level of folders for transparency and maintainability.
Leverage Analysis Services for Data Re-usability
Whenever we are asked about best practices related to Power BI Report Server, this is one of the first ones we mention. Repeat after me, “I will not create silo-ed reports!” While multiple reports can share the same dataset within Power BI service, in Power BI Report Server, each Power BI report can only reference its own data model. For example, if you are anticipating 50 Power BI reports in your environment, there would also be 50 individual data models under the hood, one for each report. For this reason, we are big advocates of leveraging Analysis Services in tandem with PBIRS. Analysis Services is a mature technology that enables the creation of in-memory, enterprise semantic models. In other words, Analysis Services can provide both performance and a single version of the truth. When using a live connection to an Analysis Services tabular model, Power BI acts as a visualization layer only (i.e., you will only see the report canvas, no modeling or data tabs while authoring reports in Power BI Desktop).
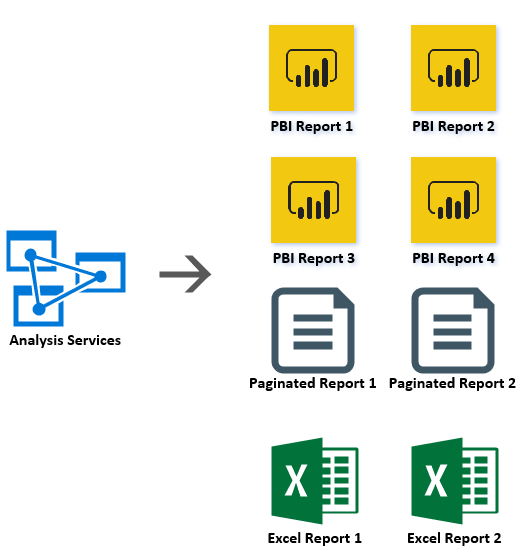
Analysis Services (SSAS) models encourage data reusability and consistency across reports.
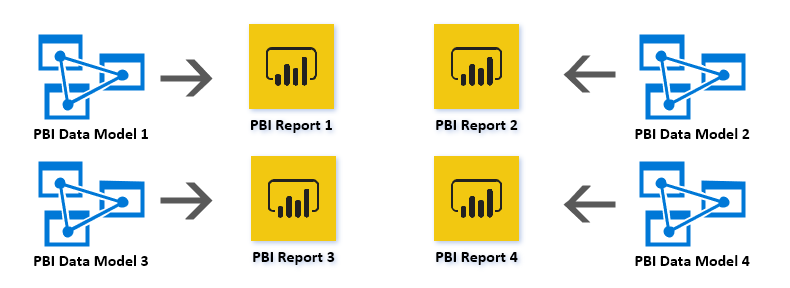
While fine for self-service BI scenarios, avoid Power BI data models in enterprise scenarios as the underlying data model cannot currently be reused for other reports.
Hybrid Use Case
Analysis Services is a great choice if you already have an investment in SQL Server, and its BI components. However, if you are implementing Power BI Report Server as part of a larger, hybrid implementation with Power BI Premium, then you can also leverage datasets that reside in Premium capacity as your reusable data models. You can establish a live connection from your Power BI, paginated, and Excel reports to a Premium dataset as if it were an Analysis Services model. First, you must ensure that your Premium capacity has Read enabled under the XMLA Endpoint setting. Next, you need to obtain the Workspace Connection for the dataset you want to connect to. This is needed to build your connection string in the next step.
Finally, you can establish a connection by selecting the following settings:
- Type
- Microsoft SQL Server Analysis Services
- Connection String
- Data Source = “
”; Initial Catalog = “ ”
- Data Source = “
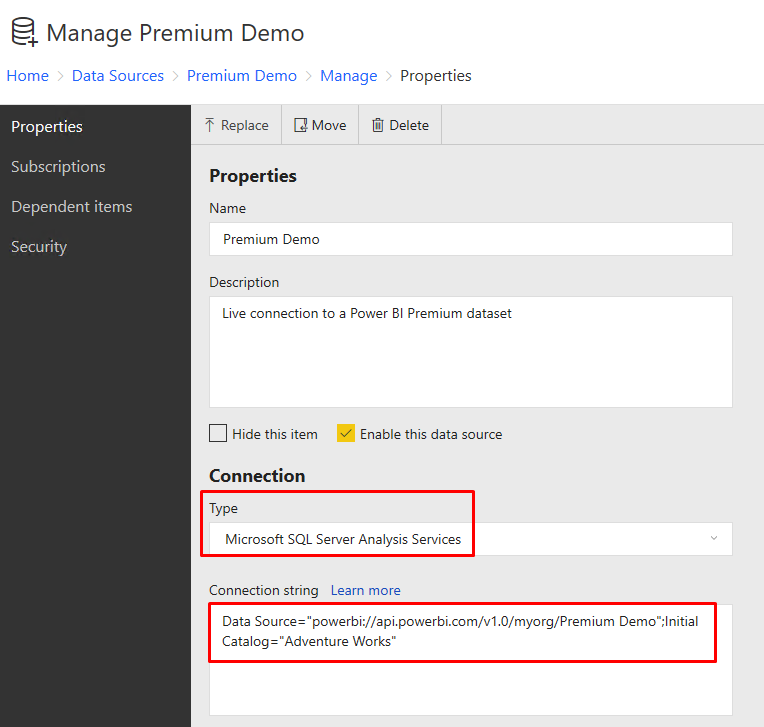
Sample connection string for a Power BI Premium dataset.
Simplify Administration With PowerShell
This is a topic that we’ve blogged about previously. We’re big fans of leveraging the ReportingServicesTools PowerShell module to streamline different deployment activities. The module will work with both PBIRS and standard SSRS.
For instance, we have leveraged this module to perform tasks such as:
- Exporting reports created by analysts to integrate them into our Git repository.
- Deploying reports to different report servers (Dev –> Test –> Prod).
- Displaying a basic inventory of our report server.
Monitor Your Report Server
Our final tip is all about monitoring report adoption, visualizing usage trends, building an inventory of your report server, and identifying any gaps in security. Power BI Report Server does not have an out-of-the-box monitoring solution. However, the underlying ReportServer database contains all kinds of useful metadata just waiting to be analyzed!
NOTE: Important! Develop reports against the underlying ReportServer database at your own risk. The underlying database schema could change with a new release of the product.
Within the ReportServer database there are many views and tables that the platform uses to store its metadata. However, when it comes to inventorying and monitoring your report server, there are some primary tables/views to start with.
|
Object Name |
Object Type |
Description |
|
dbo.Catalog |
Table |
Role-playing table that stores metadata for all the different content types found in the report server. This includes: Folders, Power BI, Paginated, and Excel reports. |
|
dbo.ExecutionLog3 |
View |
This view contains execution history for your reports. The view has some built-in CASE statements to provide additional attributes. |
|
dbo.Users |
Table |
This table has a record for every AD user and AD group that has logged into your report server. This is useful for tracking who is doing what on your server. |
|
dbo.Subscriptions |
Table |
This table contains records for both paginated report subscriptions and Power BI data model refreshes. This is useful for monitoring what tasks are being automated, and whether those tasks are running properly. |
If building your own custom monitoring solution sounds tedious, or isn’t your cup of tea, no worries! Below you can download a Power BI template file for a plug-and-play monitoring solution that we have used for several customer projects. The report requires that your report server be on the January 2020 release or later. To leverage the report, simply enter in your own Report Server instance and database name. The queries will then connect to your own report server’s database and ingest its metadata!
Click here to download the Power BI Report Server Monitoring Template.
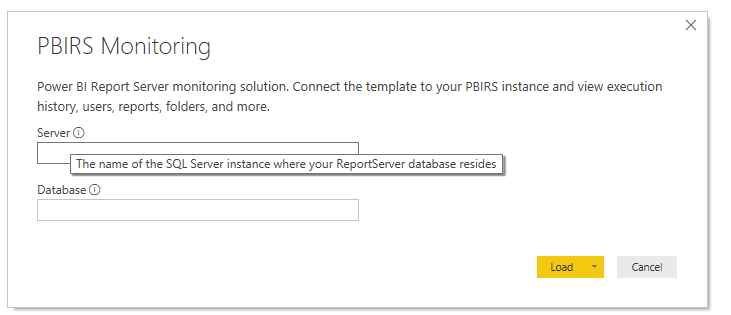 When you open the companion PBIRS Monitoring.pbit file, you will be prompted to supply your own server and database name.
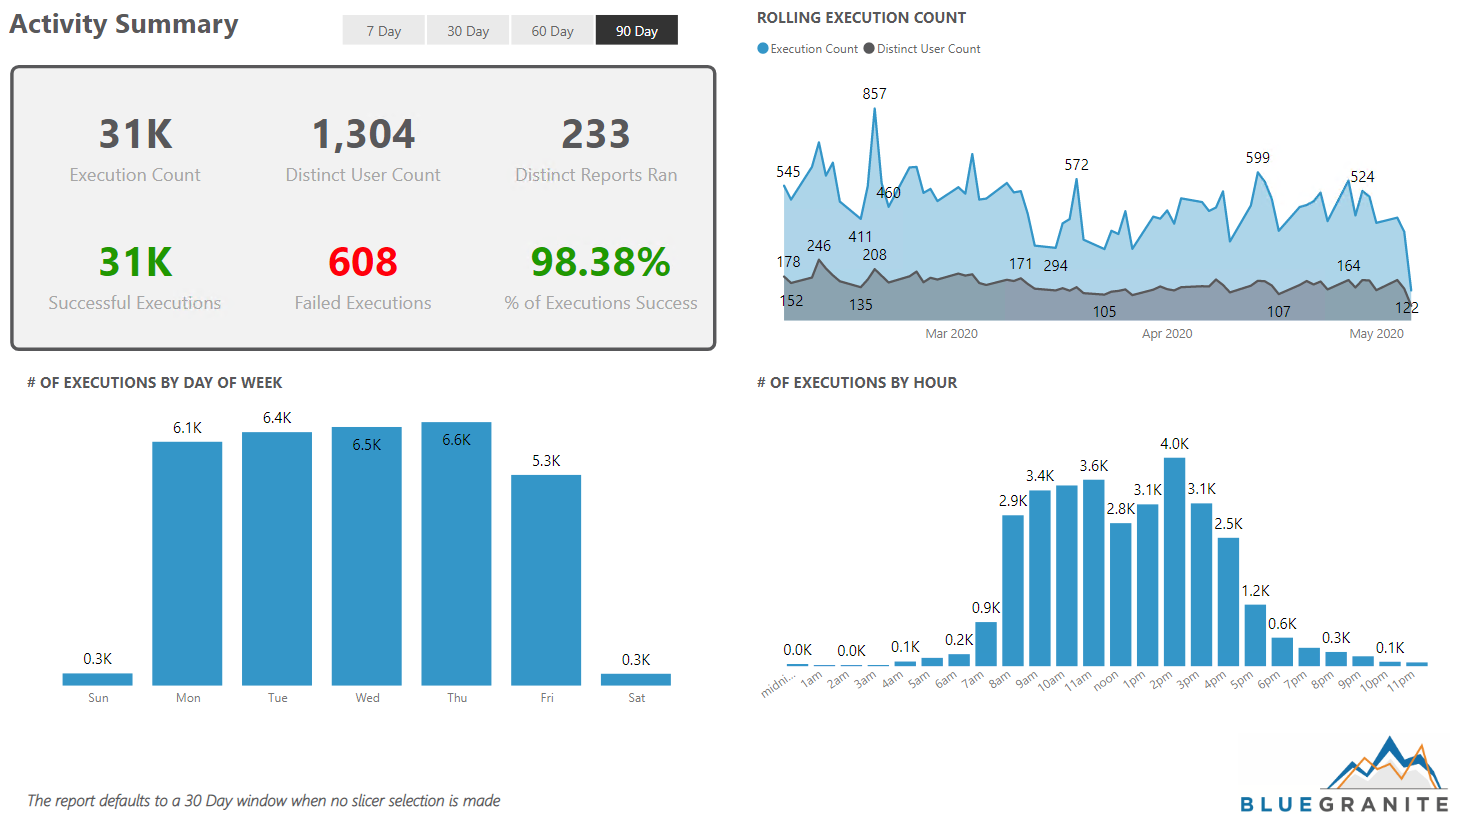
The summary page of our PBIRS Monitoring report.
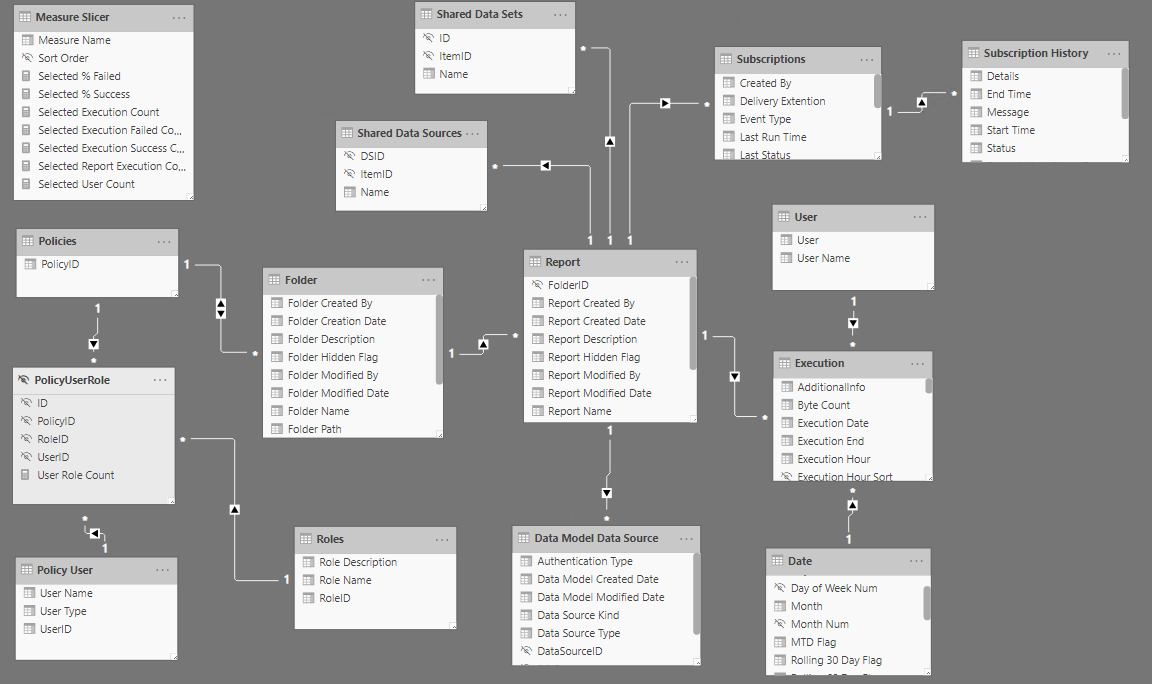
A sampling of just some of the ReportServer tables you can bring into your Power BI model.
BlueGranite can optimize your investment in Power BI with our Catalyst for Modern BI. To learn more about the key pillars of successful deployment and adoption addressed by BlueGranite’s Catalyst approach, register for our upcoming Power BI Office Hours.
Check out additional Power BI blog posts from our team at BlueGranite.


