
“I didn’t know it could do that!” I hear this statement often when I talk to data analysts about all the AI features within Power BI, and I have two theories behind the surprise. It could be due to the steady flow of new visuals and tools leveraging artificial intelligence that it is hard to stay up to date. Or, it could be Microsoft’s way of adding in AI features that are so intuitive as to appear deceptively simple. Regardless, it’s no wonder why Power BI is considered the leader in business intelligence and augmented analytics.
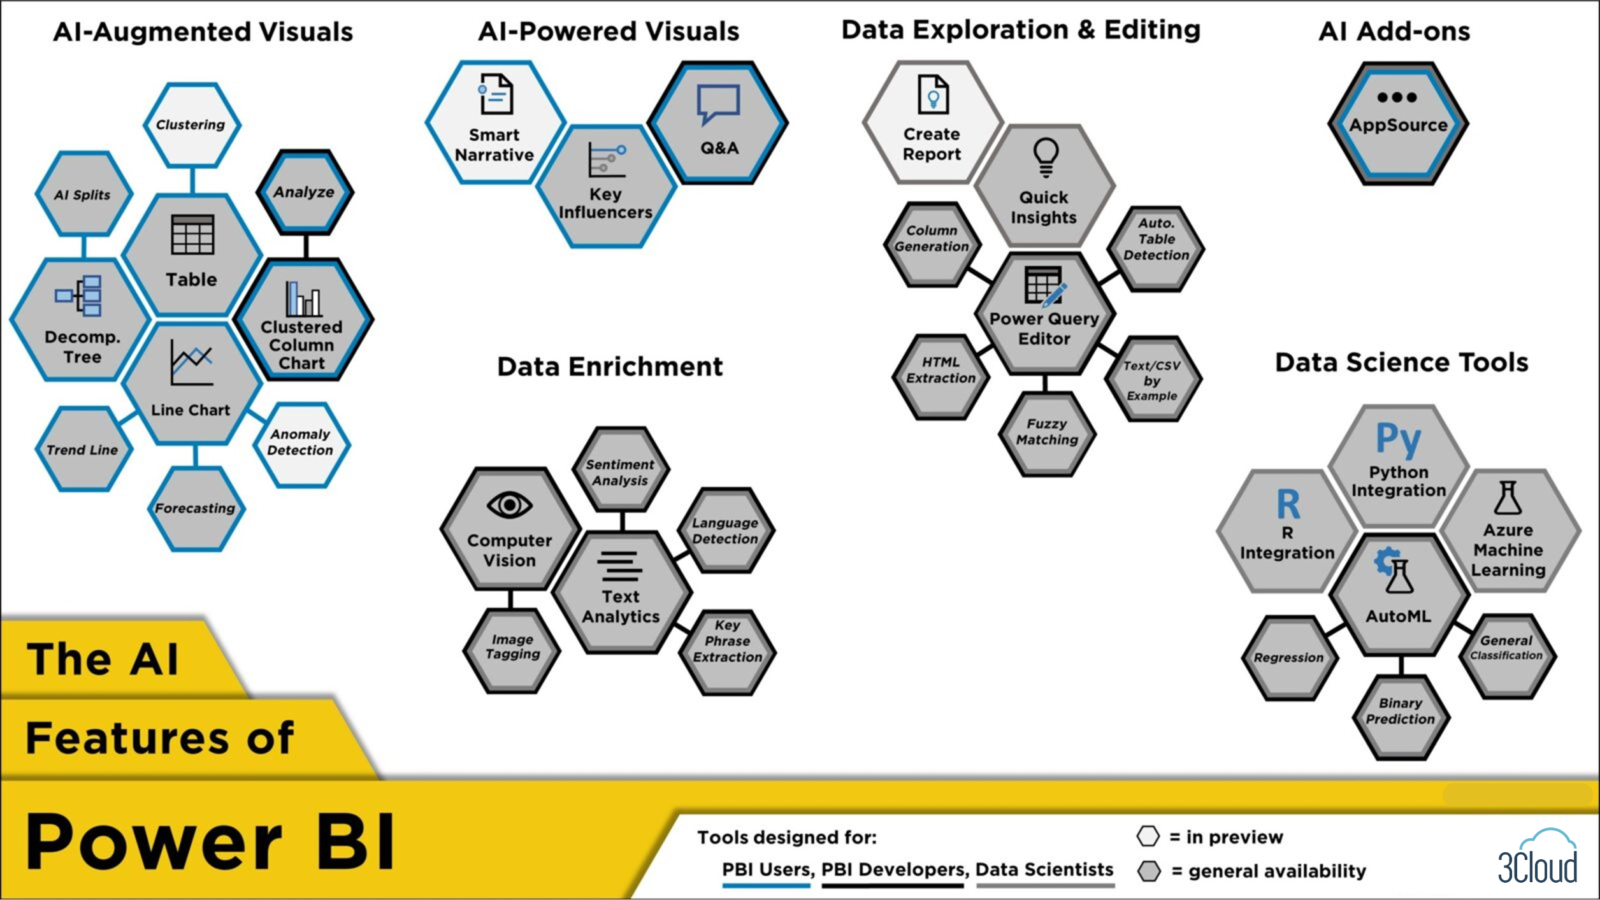
At 3Cloud, we have previously showcased the key AI features in Power BI, but I’m taking a different approach by attempting to list all the ways AI is built into Power BI. The figure above organizes the taxonomy in three ways: by feature type, grouped together under a shared label; by the primary intended role, where tools in blue are for users, grey for developers, and black for data scientists; and whether (as of this writing) a feature is in preview or generally available, shown by a white or grey fill, respectively. I’ll discuss each group in turn.
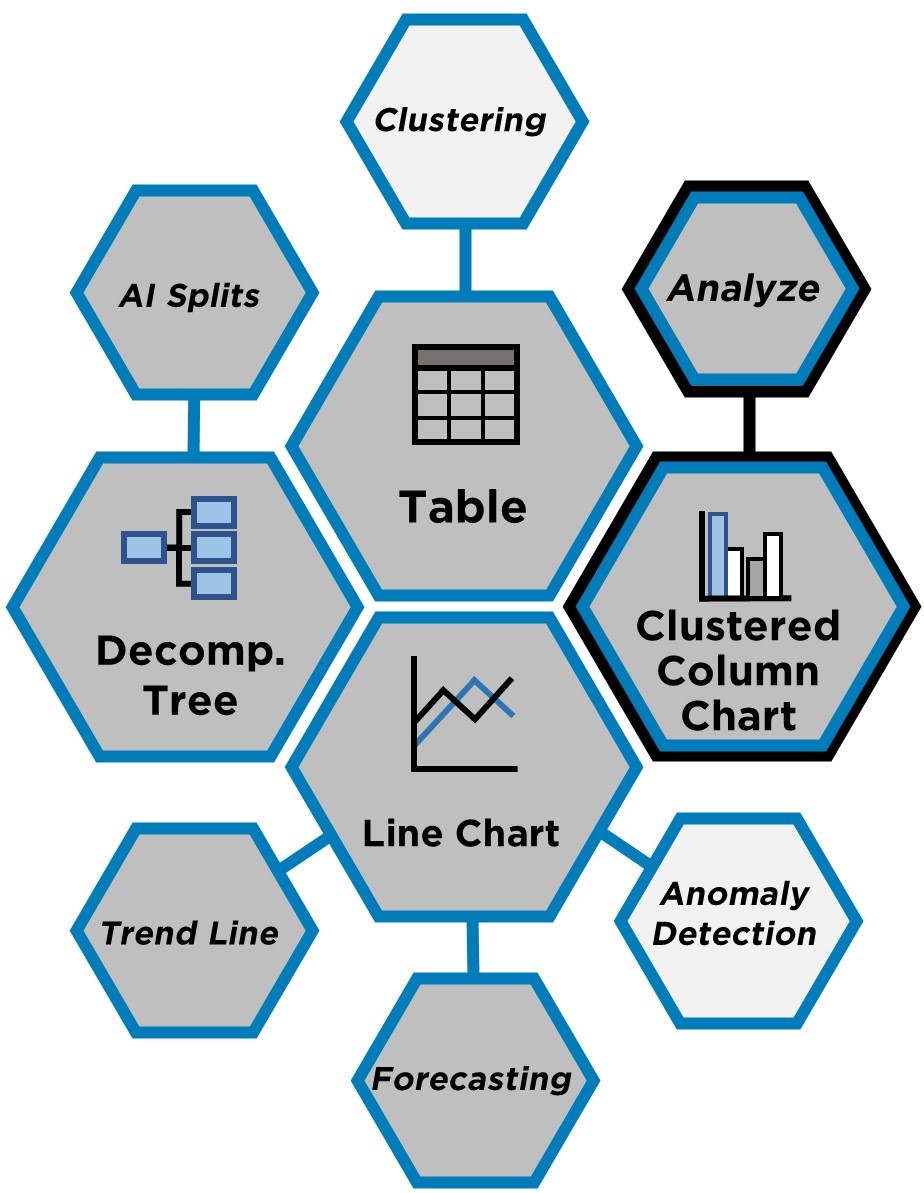
AI-Augmented Visuals
This group of features began as ordinary visuals but later were augmented with AI capabilities. Decomposition Tree uses AI Splits to identify a high- or low-value way to separate data. Clustering, available within Table and Scatter Chart, can group together similar observations and save the output as a new measure. Then there is Analyze (sometimes called “Insights”) within multiple visuals such as a Clustered Column Chart. This tool explains changes in a visual or shows where a distribution is different according to various slicers. Finally, within the Line Chart you can add a trend line, forecast a time series, or detect anomalies. All features here are built with the end user in mind, while Analyze additionally helps developers identify high-powered visuals.
AI-Powered Visuals
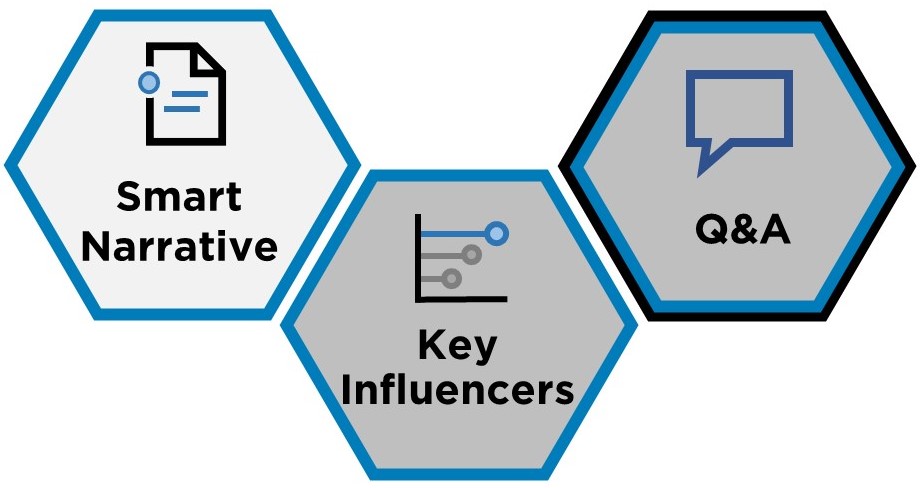
These features are distinct as being wholly built using artificial intelligence. Smart Narrative adds dynamic text descriptions of visuals, while Q&A uses text as an input to explore data (for users) and create visuals (for developers). The Key Influencers visual identifies both key influencers and top segments for a target outcome by replicating a traditional statistical and machine learning analysis in a powerful yet easy-to-use manner.
Data Exploration & Editing
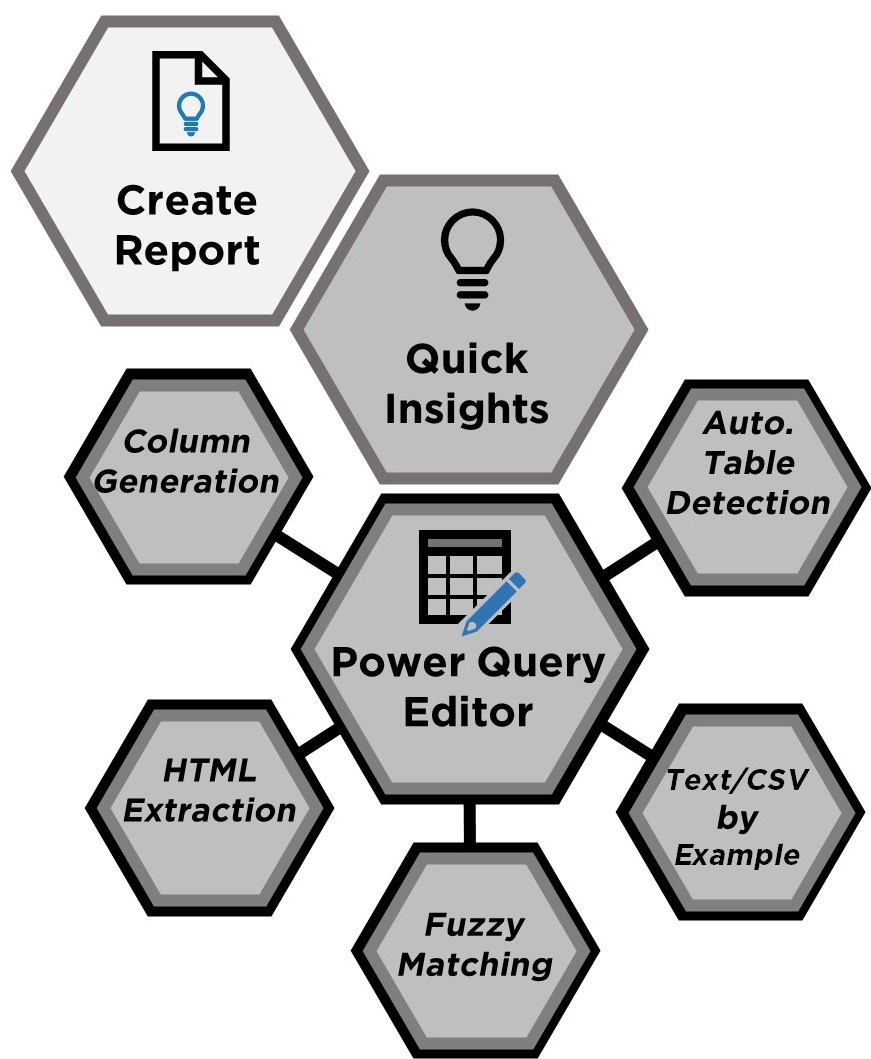
This group of features represent the different ways AI is used to quickly wrangle and understand datasets. Create Report automatically generates a report on Power BI Service based on pasted data, while Quick Insights rapidly generates interesting visuals from data. Power Query Editor, where data is transformed before being loaded into Power BI, has notable AI features. The first three are noted here: column generation, which adds new columns from examples; HTML extraction, which mines web data from examples; and fuzzy matching, which merges nearly-similar columns. Power Query can also extract data from Text or CSV files using examples as well as automatically detect tables from Excel or JSON files. All features in this larger group are designed for Power BI developers, but data scientists can also benefit from the tools within Power Query Editor.
Data Enrichment
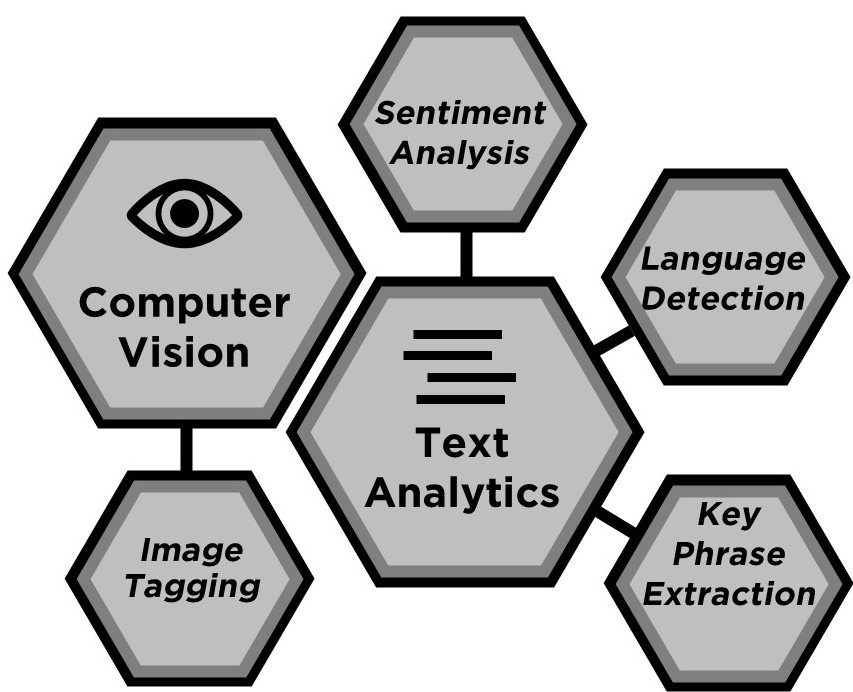
These features are visible within the “AI Insights” section of Power Query. They include two ways to augment data using Azure Cognitive Services within Power BI and are designed for developers as well as data scientists. There is Text Analytics, which can input text data and output the detected language, key phrases, and sentiment. Similarly, Computer Vision can input images and output tags for common objects identified within those images. A third method of enriching data is to apply a machine learning model; however, those features are discussed below within Data Science Tools.

AI Add-ons
Although AI Add-ons is represented here as a single feature, it is a gateway into a vast collection of publicly generated visuals designed for different groups. Many of these incorporate AI; however, documenting all of them is out of scope for this blog post.
Data Science Tools
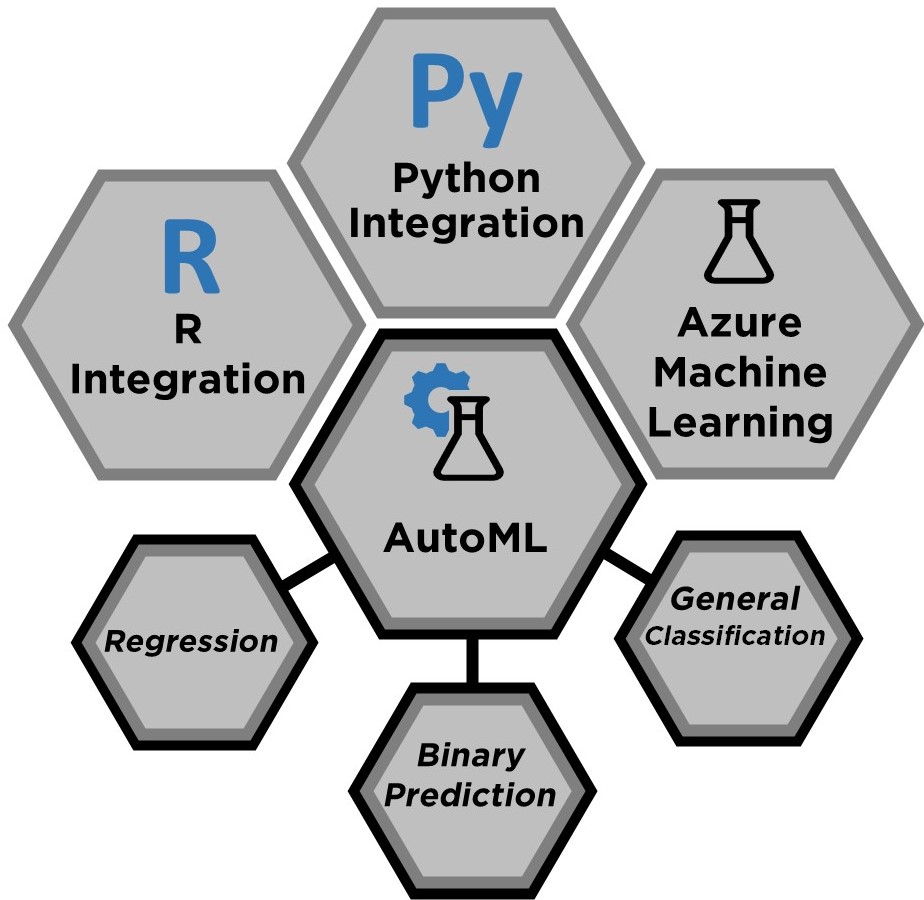
Finally, this category of features is the most like those in the traditional data science toolkit. It includes R Integration and Python Integration that can be used to score Power BI data using custom data science models built in R or Python, to perform advanced text manipulations and calculations during ingestion that are not possible using native Power BI functionality, or be used to create custom visualizations in Power BI. Power BI can also consume AI models trained on Azure Machine Learning. These three features were designed with data scientists in mind, while AutoML (Automated Machine Learning) allows non-technical developers to build, score, interpret, and deploy machine learning models within the Power BI platform. AutoML can predict outcomes based on numeric data (regression), binary data (binary prediction), and categorical data (general classification).
How to learn more
This was my attempt to catalogue all the AI features within Power BI, but I likely still forgot some. I therefore encourage you to dive into the Power BI blog to uncover more and stay up-to-date on new additions. If you want to start using more of these features yourself, I suggest looking into our newly developed OpenAI offerings!
Let our experts at 3Cloud come alongside you and leverage our technical experience to provide guidance on how to apply and work with OpenAI along every step of the way in your AI journey. We’re committed to making the power of OpenAI known far and wide. We recorded our Intro to OpenAI Webinar so you can learn more at your own pace. We’re also taking our knowledge on the road by facilitating an OpenAI Roadshow across the US, with our experts on site to answer any questions you may have. We also offer a 1 hour Exploration Workshop, and an 8 hour Envisioning Workshop to help you best acclimate to this technology based on where you are starting from and what you would like to try. Ready to jump right in? Check our OpenAI Jumpstart solution to see if it’s the right fit! And let us know if there were any features we forgot! Contact us today.


