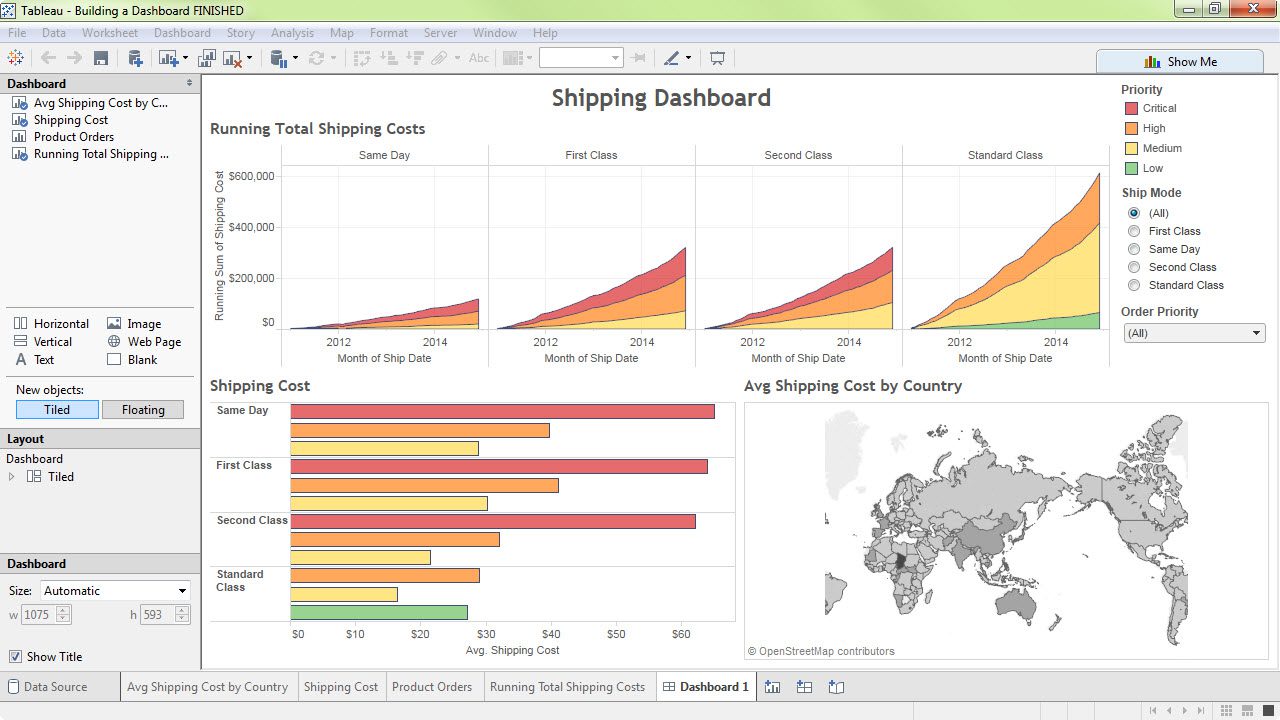
Those of us, who are now decent with Tableau, can probably remember the days when we first started using Tableau. We connected to a data source and started dropping dimensions and measures from the left to the right and not really sure what would eventually appear on the right as we were dragging. The suspense of moving the mouse, the frustration of the unexpected results, and then finally…once we watched a few videos and figured out how the tool works, the gratification and pride of an awesome dashboard. Getting started can sometimes be a challenge though, especially if you are new to Self-service BI tools.
Do you know the difference between a blue pill and a green pill? What happens when you add a green pill to the color shelf? Pills, cards, and shelves are the foundation of Tableau visualizations. If you are new to Tableau or have been playing around with it but not quite sure how to get the view to look the way you want, we have a video for you! In this video, I’ll help you understand pills, cards, and shelves so instead of wondering “Why did Tableau do THAT?” you’ll be in better control of what you want Tableau to do.
Hopefully you are having fun with data visualizations! Being part of the Tableau community, we are compassionate people who love helping our fellow vizzers. The goal of this blog is to help users starting off with Tableau get better ground. In the video above I’ve few things I learned along the way that should help getting started much easier.
When connected to a relational database that is slow because it might not be optimized or well indexed, try using an extract while you are building. Tableau allows you to use a live connection or extract connection for the data source. Extracts are saved locally which increases performance because Tableau doesn’t have to go back to the live source to pick up data. Once you are done building, turn the live connection back on so your data refreshes automatically.
Tableau has a collection of videos to help you get started. The Quick Start page has a list of the more useful videos or articles.
Use the community! If you get stuck, use the community forum. You can ask any Tableau question and if people can help, they will. It’s free! Usually, you will be asked to package your workbook so those helping you can see what you are having trouble with. Once you become an expert, you can return the favor by answering questions on the forum!
Looking for a solution specific to your needs? Contact BlueGranite to learn how we can help you move your business forward. Interested in Tableau? Click here for a free trial of Tableau Desktop.
Visit other great Tableau blog posts from the BlueGranite team: http://www.blue-granite.com/blog/topic/tableau. Or join us for our upcoming Data Visualization webinar. Click here to register.


