
This post walks through a new report in 3Cloud’s Power BI showcase – a series designed to highlight key capabilities and tools within the Power BI platform using real and reproducible methods – and introduce the data and features used to create it.
The fictitious ABC Apparel Company would like to see what buyers have been saying about their products recently. Users who make a purchase from ABC Apparel are asked:
- whether they recommend the product
- how they would rate the product on a scale of 1 to 5
- to review the product in a free text form
A Power BI report was made to analyze this information. It contains a summary of reviews, ratings, and recommendations sliced by the most important categories for ABC Apparel. In addition, we can also see ratings distributions for the most important categories, and we can drill down to see the individual reviews. ABC might be having a problem with repeat customers, so they are turning to reviews to see if it exposes any product issues. Or they might just be doing a brand health check and want to be sure that there are mostly positive reviews left on their website.
The Data
The source data came from Kaggle and is available under a CC0 1.0 Universal license, making it free for commercial and non-commercial use. The dataset contains real data that has been anonymized.
Power BI Features Showcased
This report takes advantage of several great features and capabilities for building models and reports in Power BI Desktop:
- Layout background images
- Tooltip reports
- Drillthrough actions
- Custom visuals
- Bookmarks
- Buttons
- DAX calculations
An explanation of how these features are used can be found in this post after the report description.
The Report
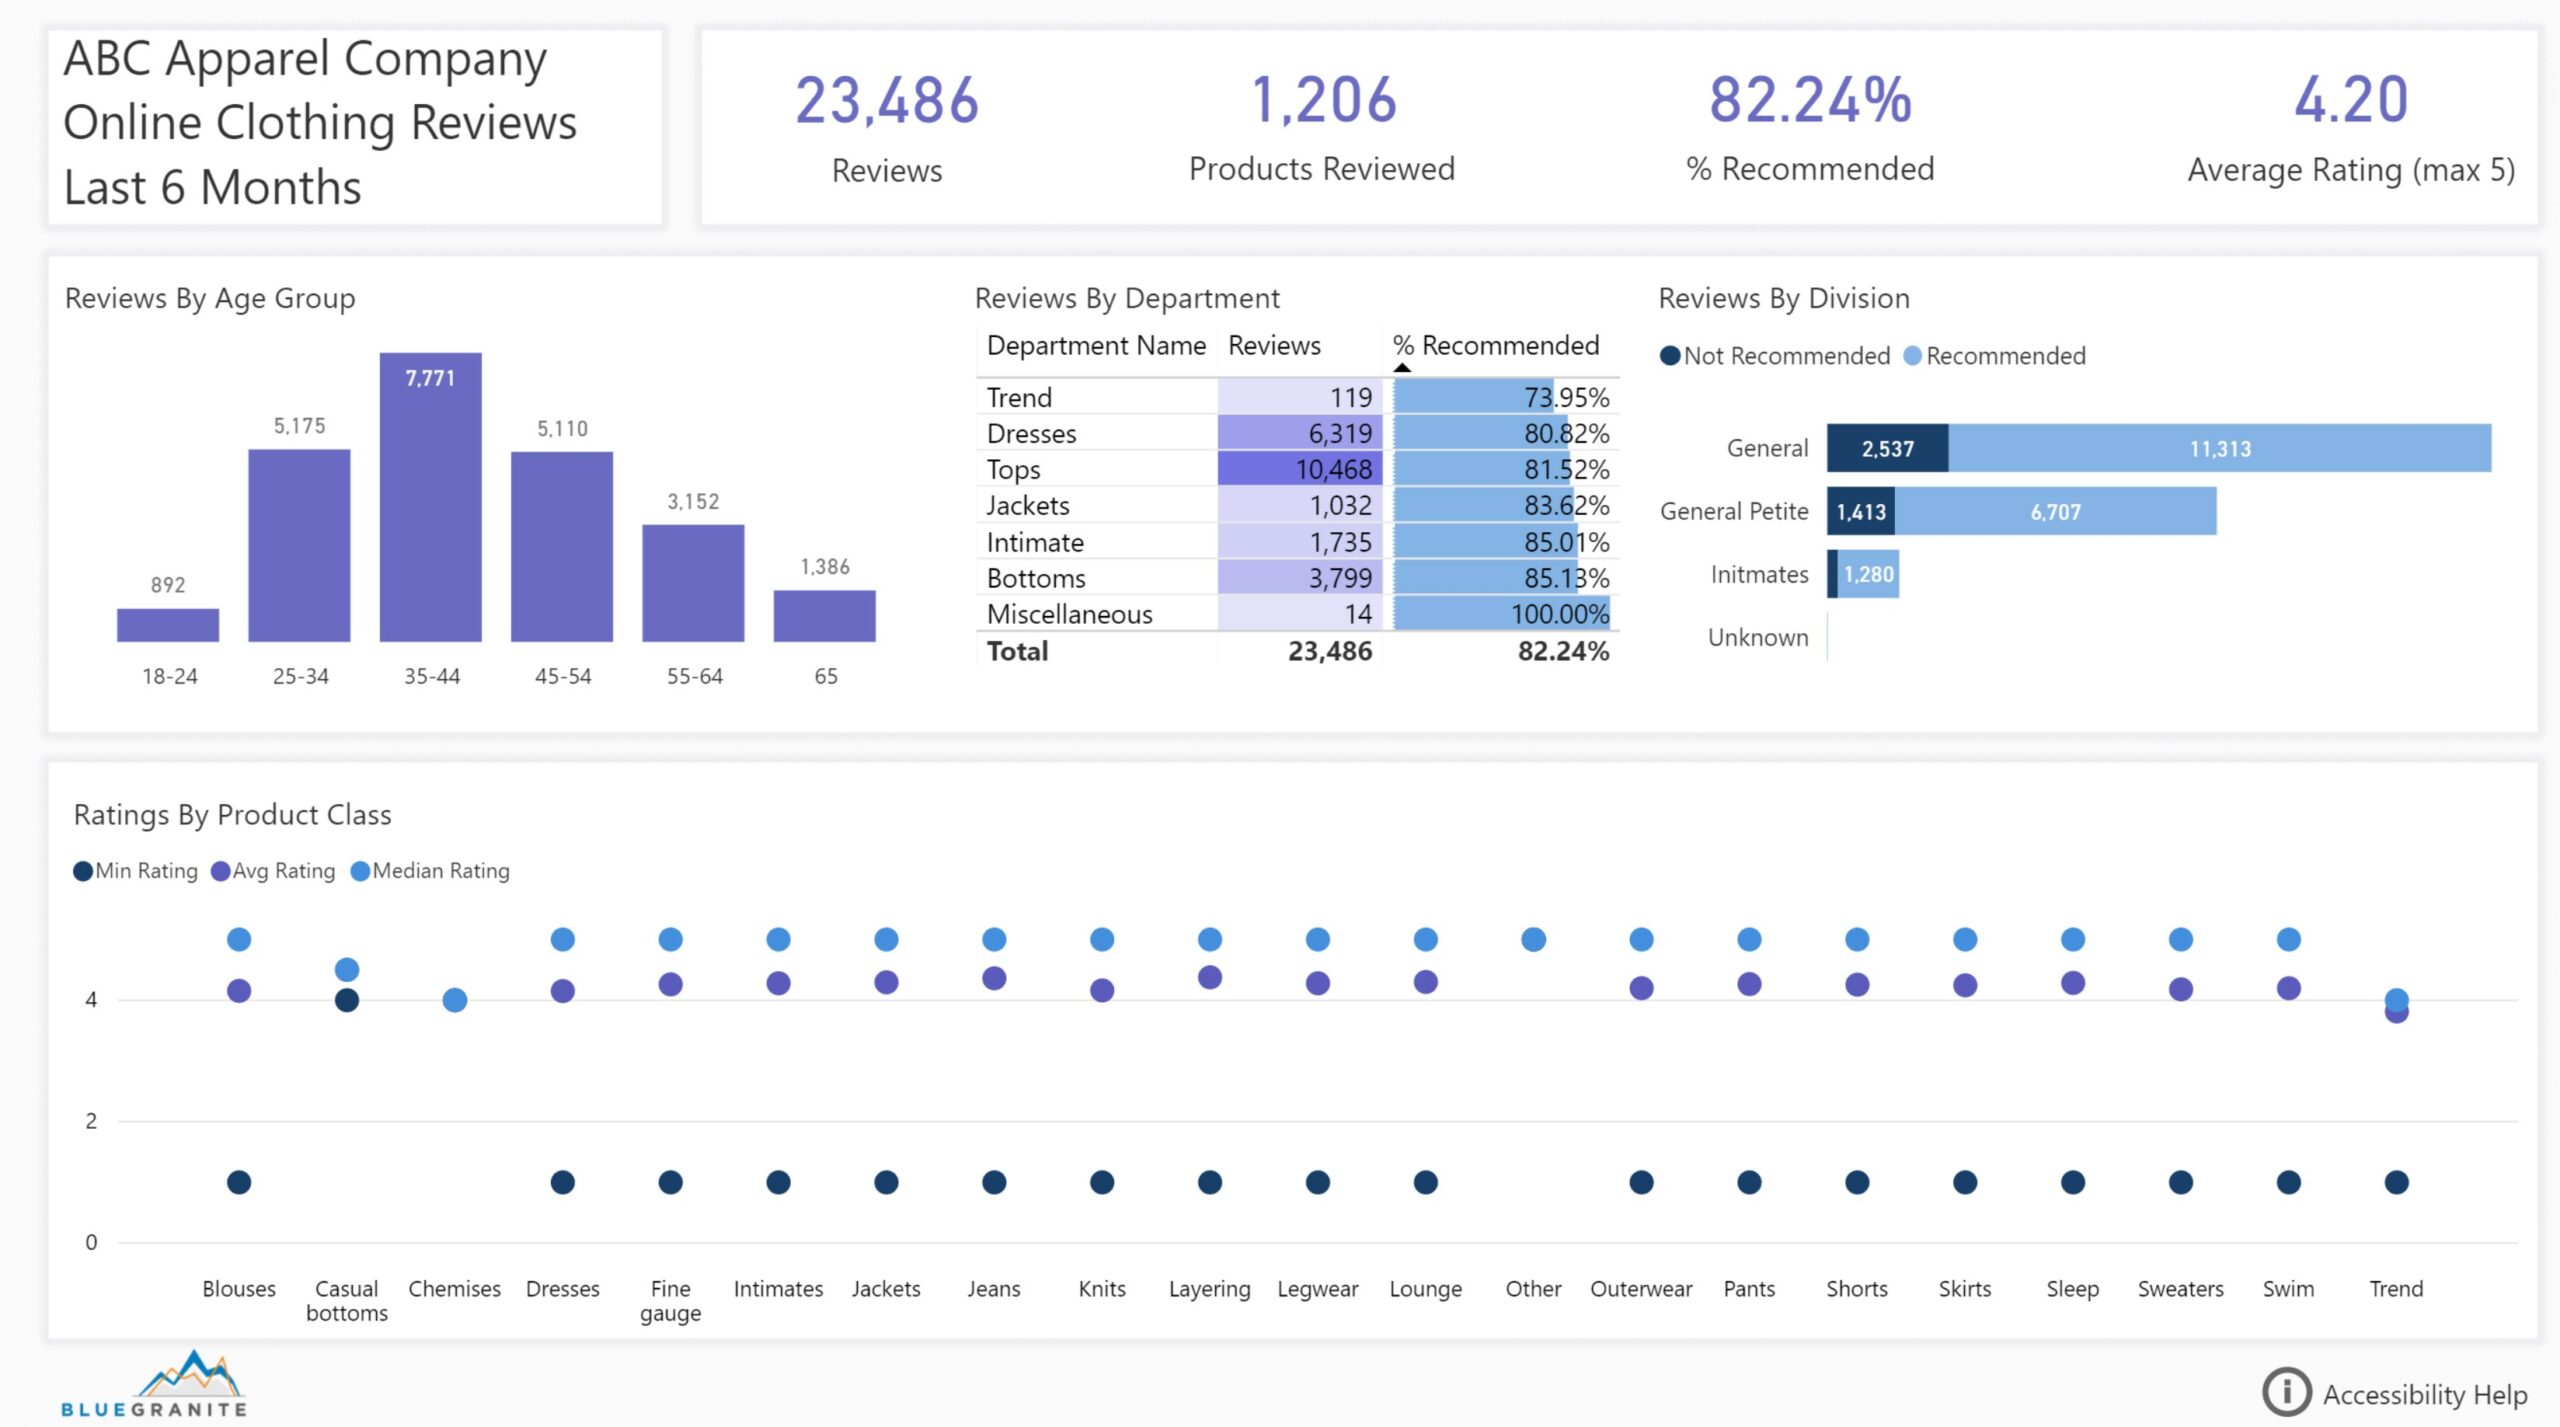
The native interactivity of Power BI reports facilitates quick and easy exploration of trends and relationships in the data. The summary page of the report presents totals and averages for all reviews and then goes one level deeper to look at reviews by age group of the reviewer and the department, division, and class of the product.
| Note: As you explore the report on your own, I recommend clicking the double arrow in the bottom right corner to view the report in full screen mode: | 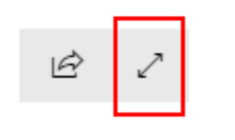 |
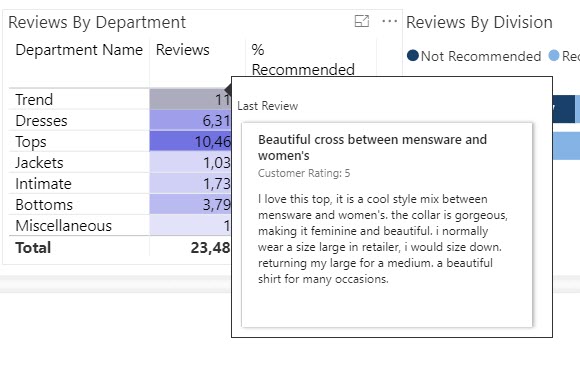
As users click through the summary page, they notice that buyers age 35 – 44 are by far the most common reviewers on the site. They can also see that tops are the most commonly reviewed products. In general, ABC’s products are highly recommended. Just by clicking on the bars in the Reviewers by Age chart, we get some insights. Buyers age 18 – 24 are a smaller group but seem to be happier with the products they buy. They recommend 86.7% of the products they review and give the products an average rating of 4.33. This is higher than the overall 82.2% of products being recommended and 4.20 average rating. This could mean that ABC has a mismatch between the styles offered and the target audience, or it could mean that buyers age 18 – 24 simply don’t leave as many reviews, which could be remedied with some incentives such as discounts or loyalty points. Items in the trend department have a lower percentage of reviews that recommend the products. Hovering over the row for Trend in the Reviews By Department table displays the last review that was left on the website in the last 6 months (the time period shown in the report). The comment mentions sizing issues, so it’s worth investigating further if that is a common trend.
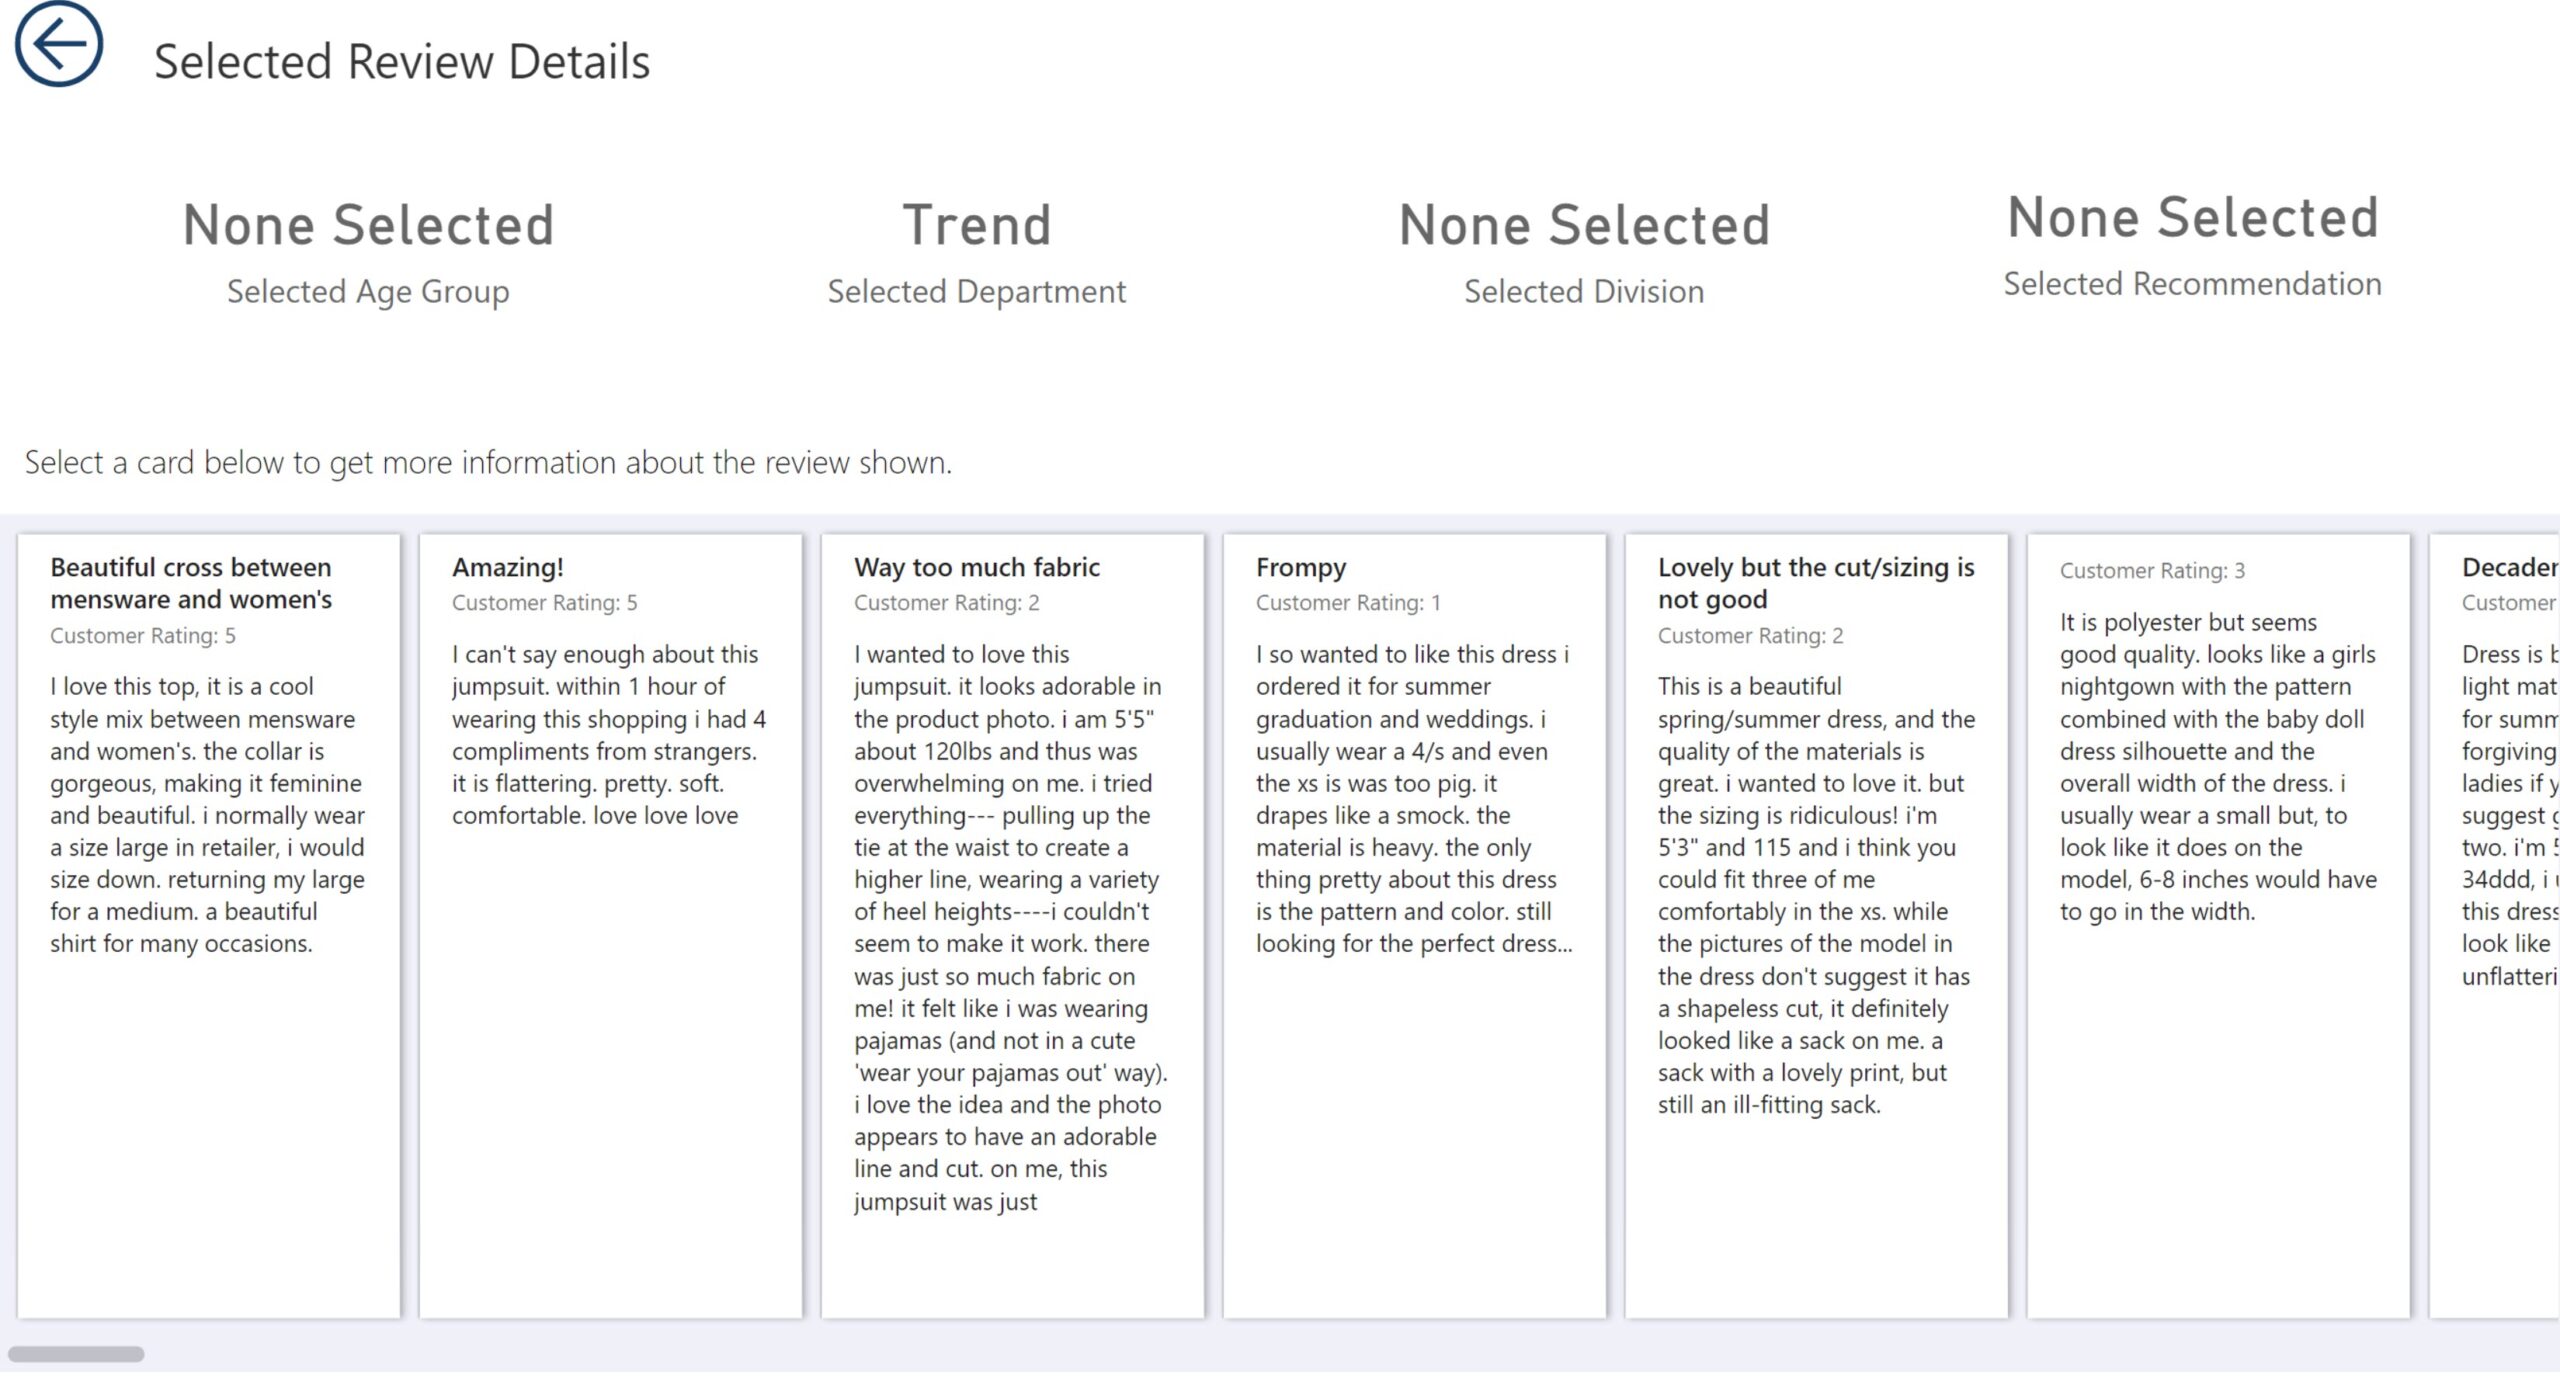
 Users can then drill through to a detail page to see whether the sizing issue is commonly mentioned in comments. From browsing the first several reviews, more than half of the reviews mentioned size or fit issues. By selecting a single card in the visual on the bottom half of the page, we can see more information about the selected review, including the product ID, class, department, division, and whether the reviewer recommended the product.
When the user is finished looking at individual reviews, they can return to the summary page using the navigation button at the top left of the page. The bottom visual on the summary page allows users to see whether there are any large variations in ratings when looking at the products by class. We again see that trend products are rated lower than products of other classes. We also see chemises are generally rated lower than other classes. By clicking on the Intimate department in the table above to cross-filter the Ratings by Product Class chart, we see that everything else in the department is doing well, and it is just the chemises suffering from lower ratings.
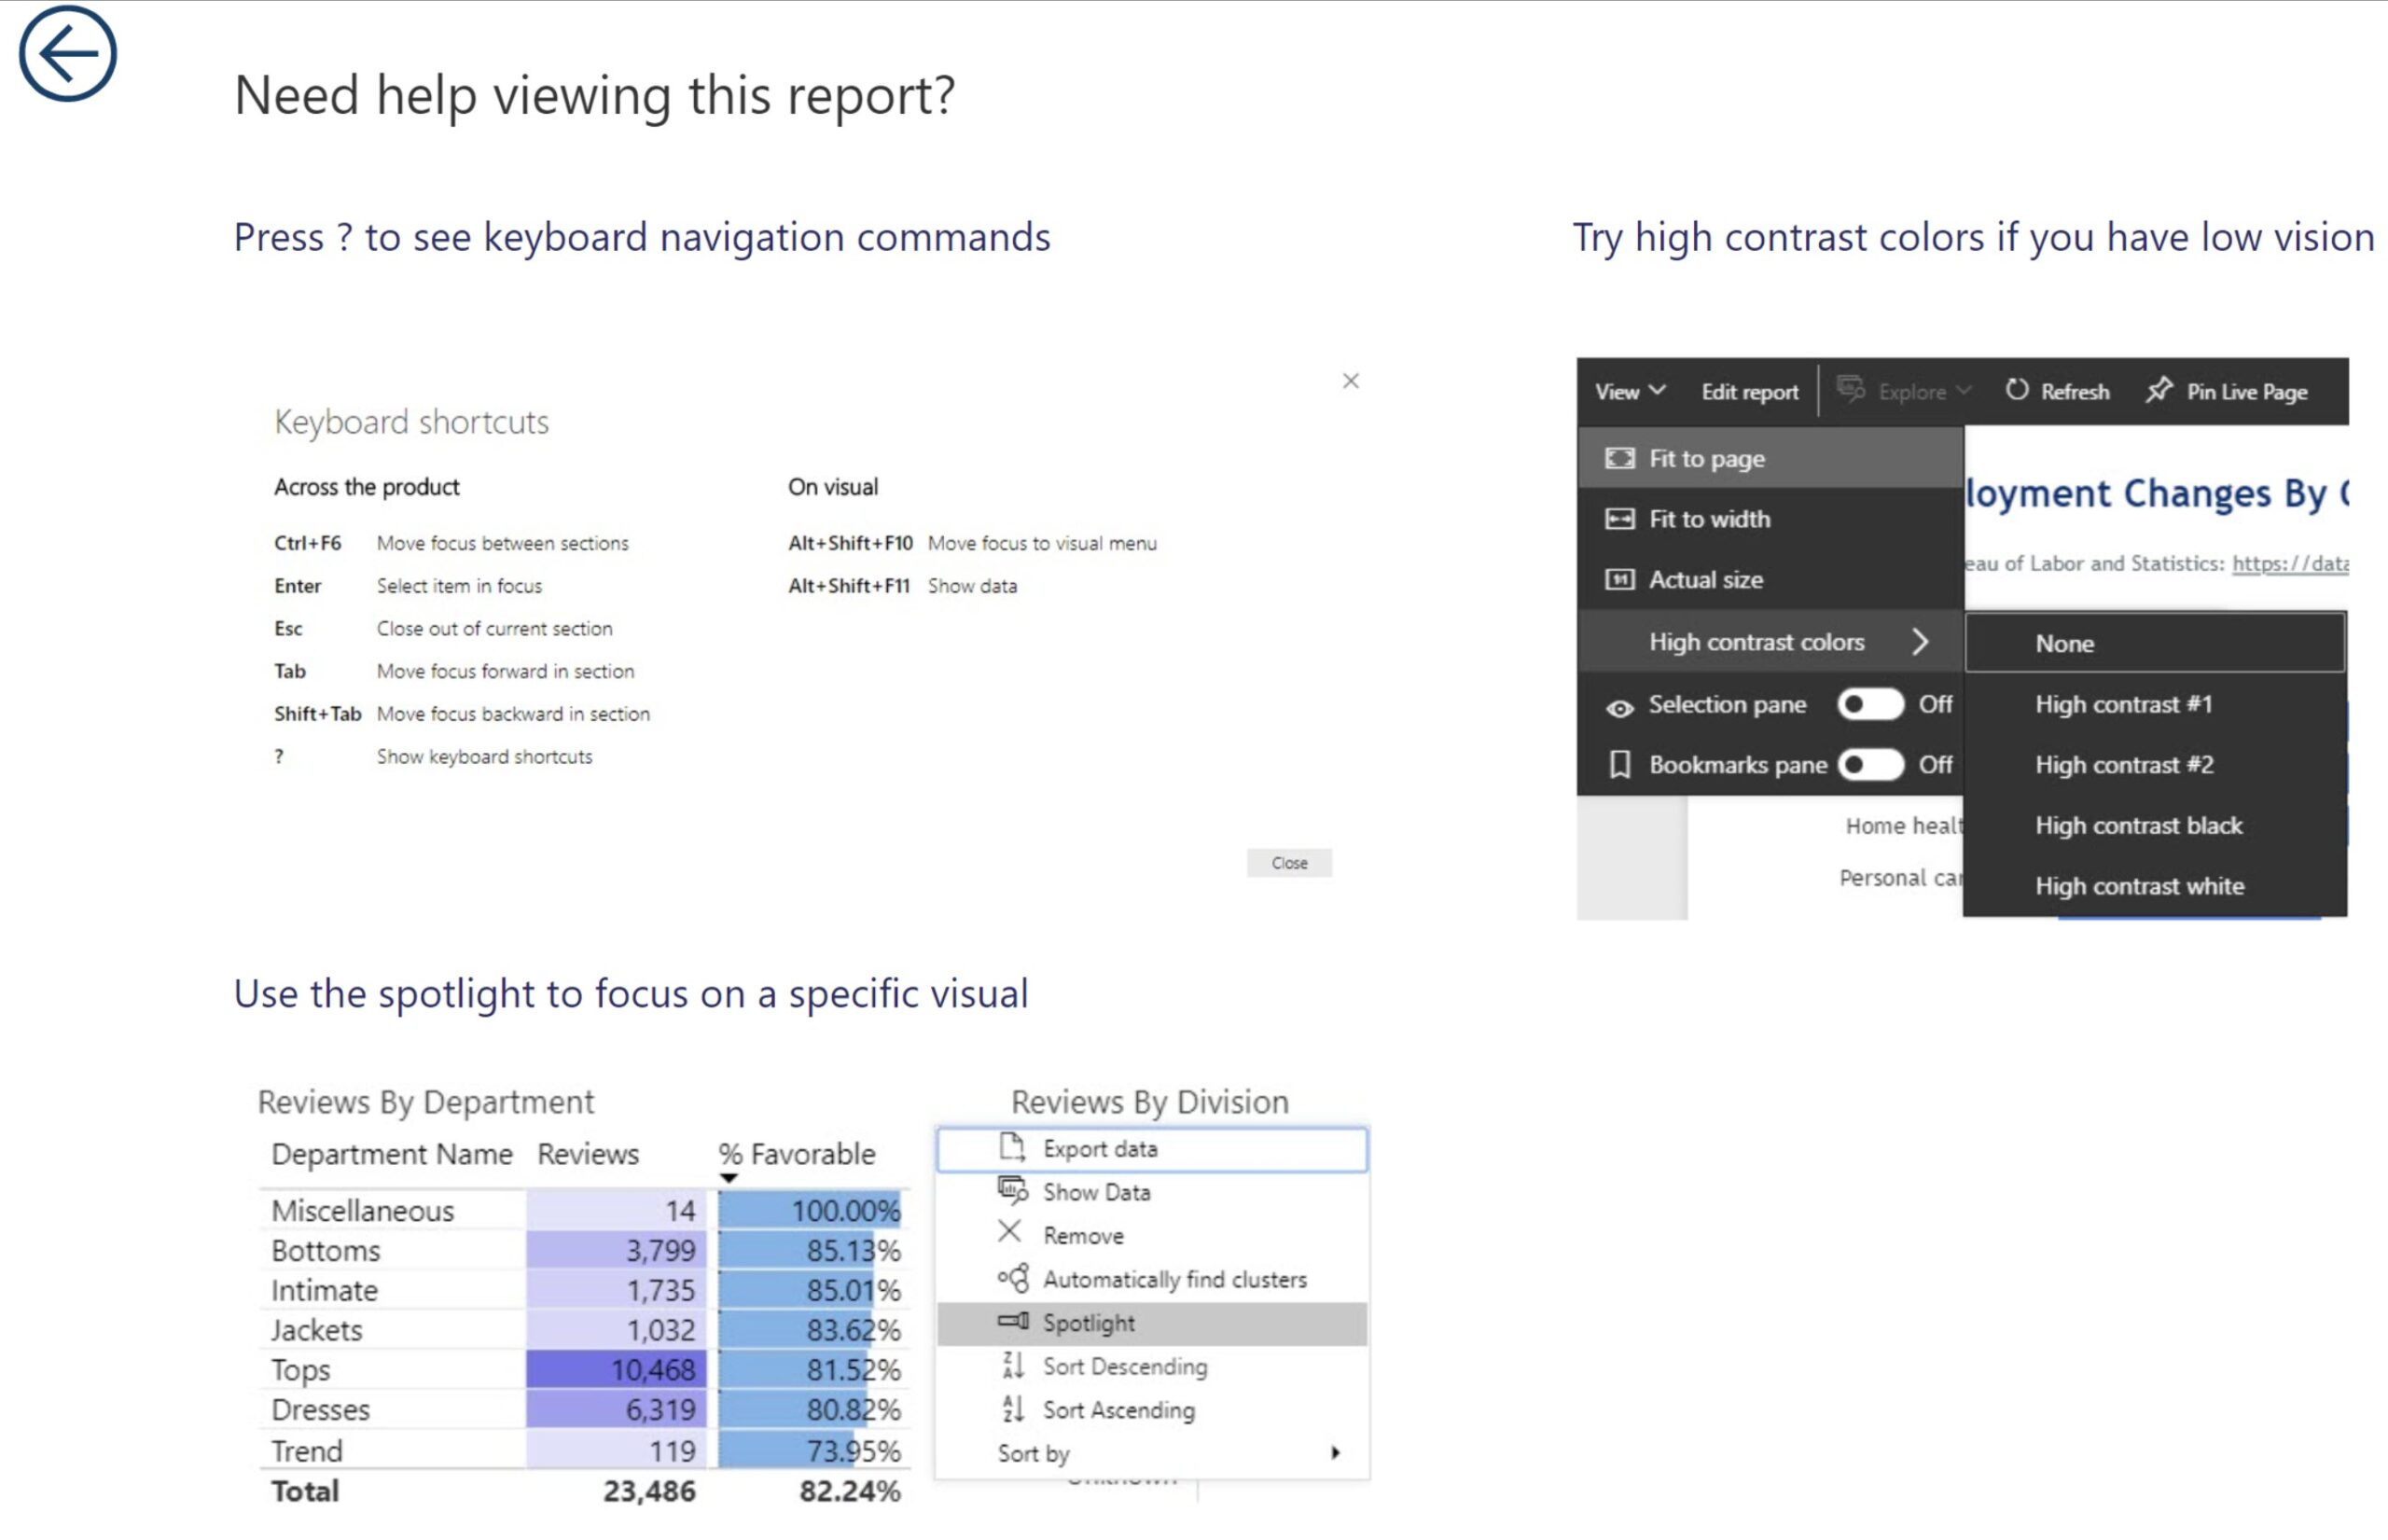
People from a variety of backgrounds and abilities use Power BI to get important organizational information. For those that may be new to Power BI, a link to a separate page highlighting accessibility features is included at the bottom of the summary page. This can be helpful for users that don’t use Power BI much and aren’t aware of the accessibility features or for when new accessibility features have been added that might be important to the report audience. Clicking on the icon takes the user to a quick page that highlights three big accessibility features. Alt text has been populated for users that use a screen reader to consume the page. Keyboard navigation is available for users that can’t or prefer not to use a mouse. High contrast color settings are available for those with low vision. And the Spotlight feature on each visual helps users that struggle with processing visual information to send everything else to the background and focus on one chart at a time.
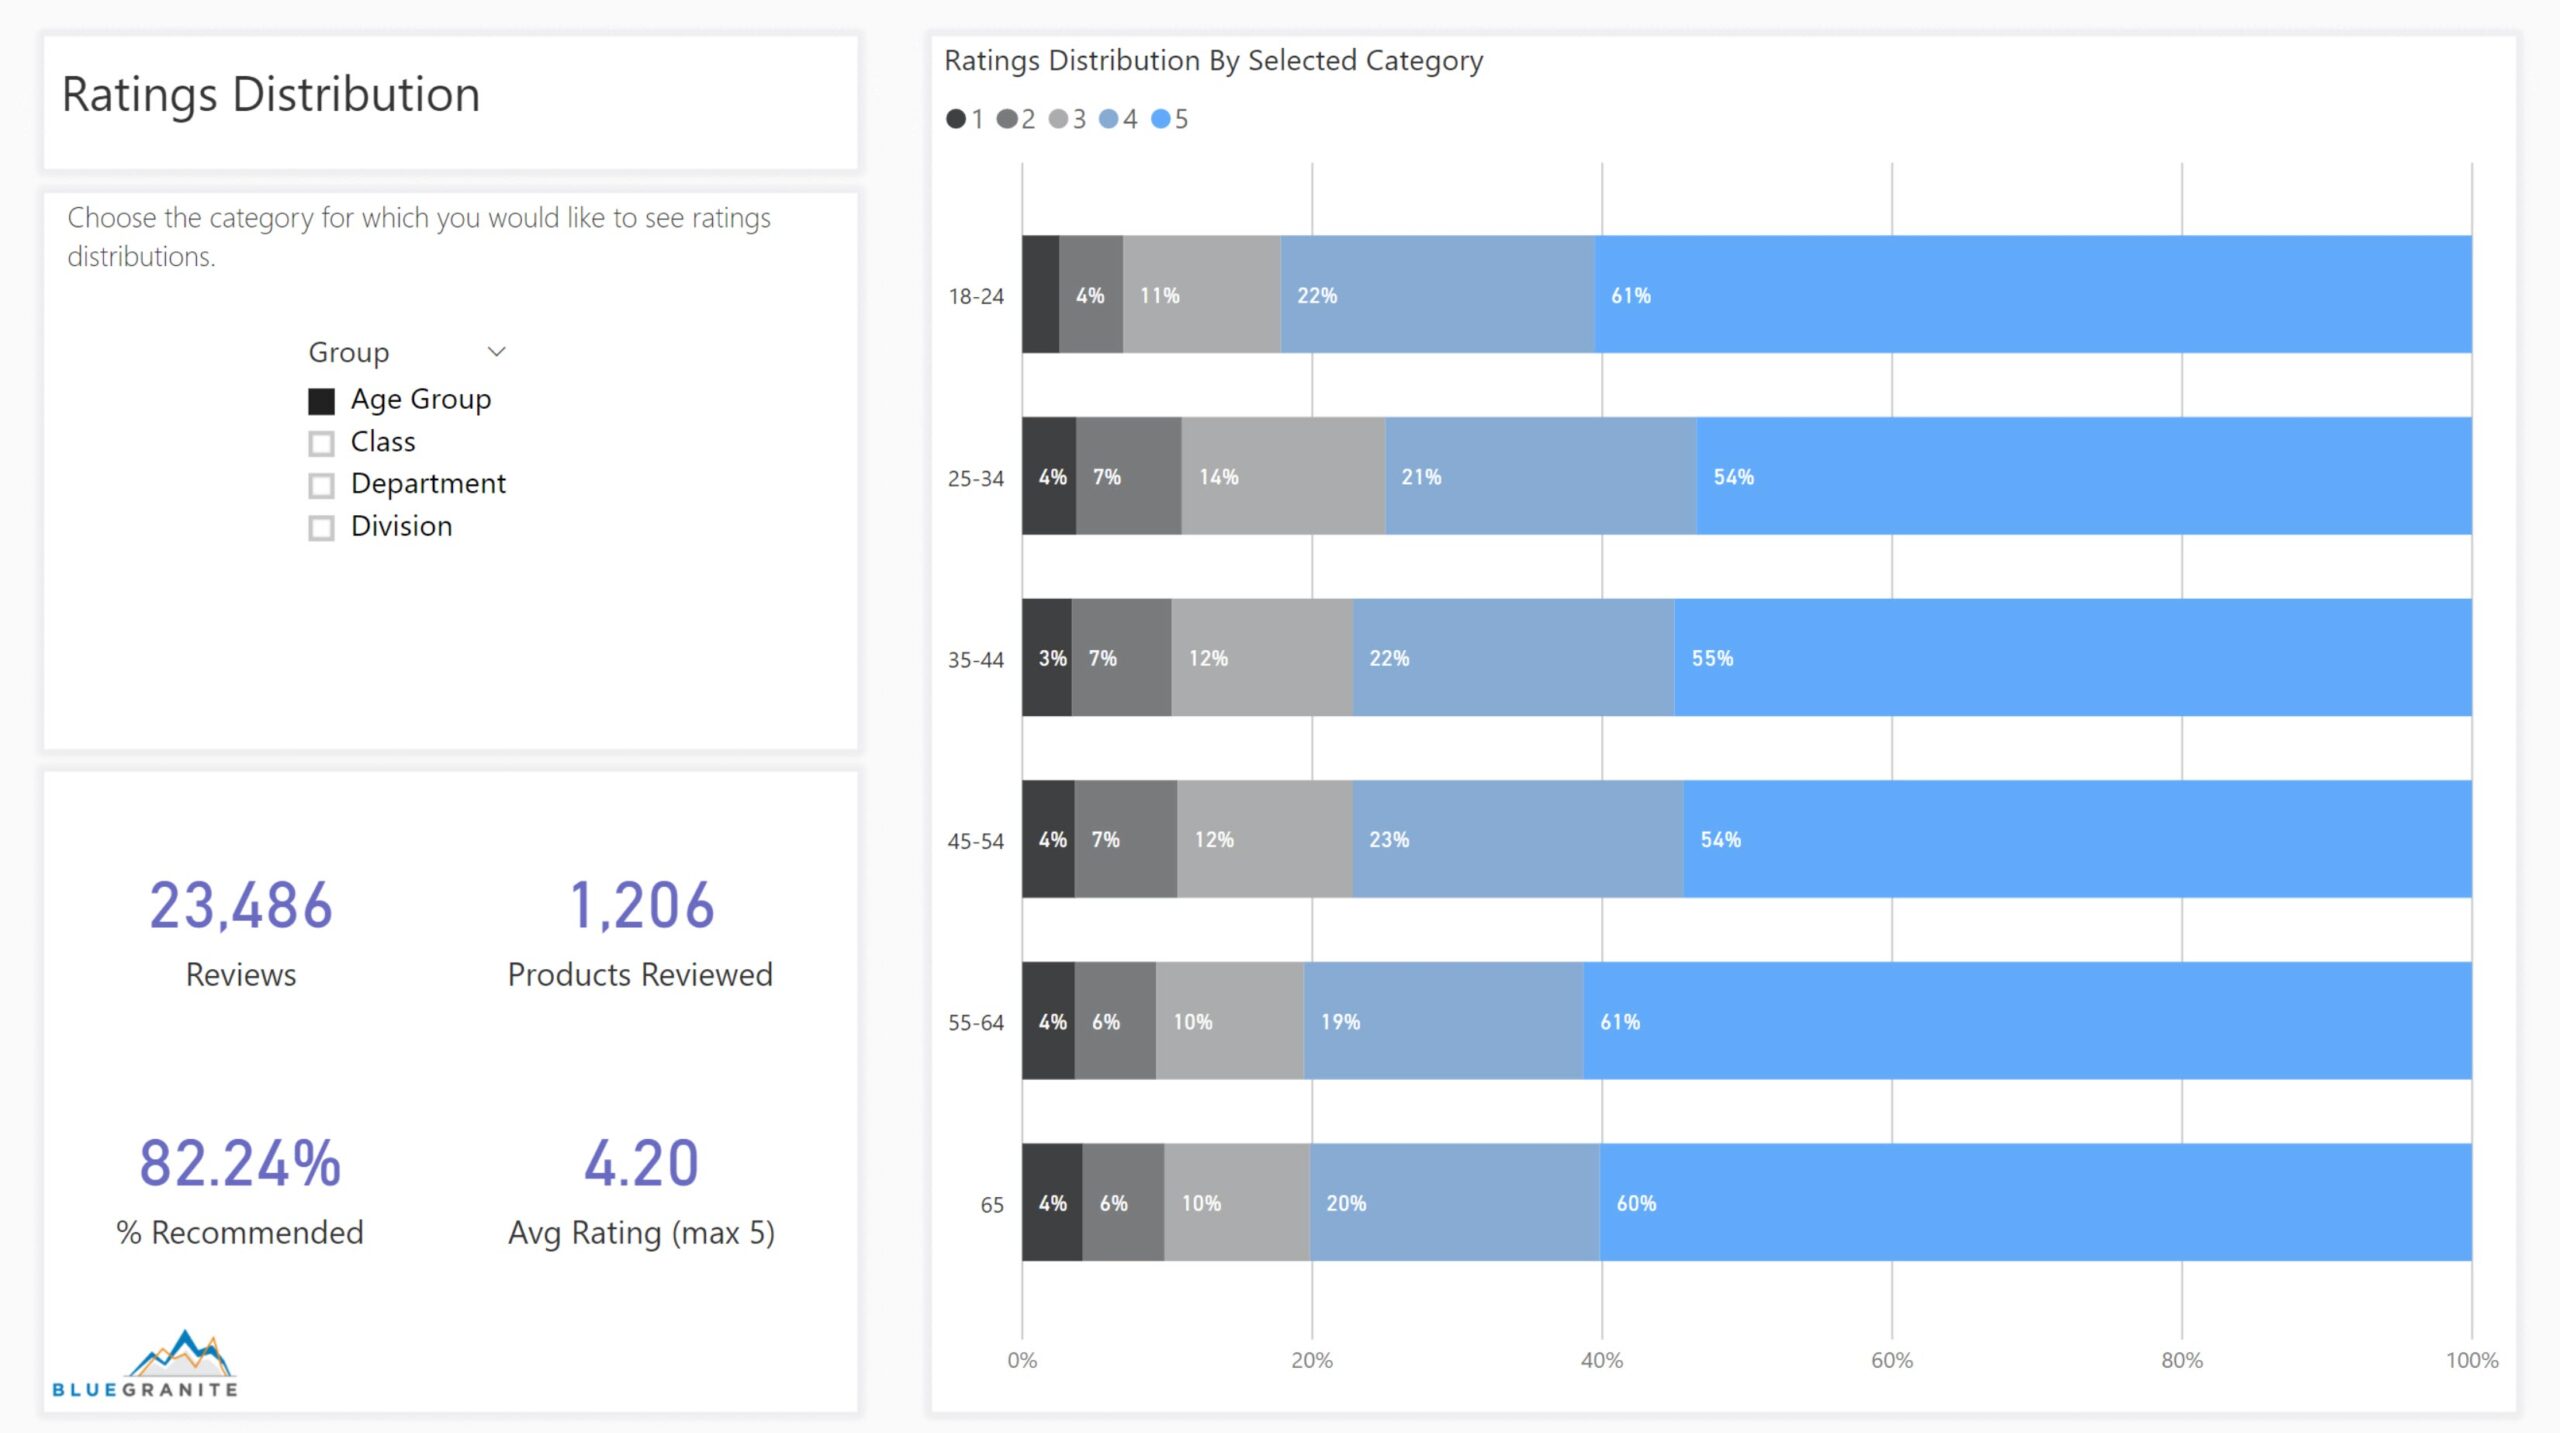
The second page of the report shows the distributions of ratings for the selected category with some summary statistics in the bottom left quadrant. Where users saw the average rating on the Summary page, they can now see the proportion of ratings that each rating value (1 – 5) represents. On the Ratings Distribution page, we can see that the low average rating for chemises is largely due to a small number of reviews which lean negative. When looking at the ratings distributions by department, we see the lower percent of recommended products goes along with the higher percentage of rating values of 1, 2, or 3 compared to other departments. And Trend is the only department that does not have a majority of ratings with a value of 5.
After exploring this report, users should have a better understanding of which products are highly rated and which are struggling, as well as which age groups review and recommend the company’s products the most. Drilling into details provides specific feedback on the best and worst features of each product, which could be useful for making changes both to product sourcing/purchasing and to how the product is described on the website.
Power BI Features Explained
The layout in the background of both the Summary and Ratings distribution pages is a background image created in PowerPoint, exported as an image, imported into the report, and applied to the page. Some third parties offer layout images for Power BI reports as well as report themes, so you don’t even need to make your own.
Tooltip reports provide the functionality to hover over the table and see the last review. To make a tooltip report, it’s easiest to use the Tooltip page size. Then enable the report to be a tooltip in the Page Information settings and set the tooltip on the visual over which you want to hover to see the report.
A drillthrough action is used to navigate from the Summary page to the Review Details page, and a button is provided for navigation back to the Summary page. Users can right-click on any age group, department, or division and choose Drillthrough and then Review Details to access the drillthrough page.
Custom visuals allow visualizations that aren’t available out of the box in Power BI. The dot plot on the Summary page is the Dot Plot by OKViz custom visual available for download in the marketplace (AppSource).
The Accessibility Help icon is a button linked to a bookmark. The Accessibility Help page was created, and then a bookmark was created to point to that page. Then the button was added to the Summary page, and the button action was set to go to the bookmark.
The Ratings Distribution page makes use of some DAX tricks to allow users to change the category shown on the y-axis of the chart. A calculated table was created that makes extensive use of the CROSSJOIN, VALUES, and UNION functions. And then calculated measures were added on top of it.
Why Power BI?
Power BI combines data visualization capabilities with powerful modeling capabilities to create interactive reports in a short amount of time. Power BI Desktop and PowerBI.com provide the features necessary to create reusable semantic models that support compelling visuals which effectively communicate insights to users.
You can explore the live version of the report here. Check out the previous installment in our Power BI showcase “Employee Retention – Organizational Flight Risk” here.
Whether you are interested in deploying Power BI interactive analytics within your organization, or you want to get up to speed with training on its capabilities, please contact 3Cloud. We would be happy to share our knowledge and experience.


