
In modern Supply Chains, the one constant is change. The increasing rates of change have led to new methodologies built around planning for and optimizing agility. In addition, the uncertainty of the past 2 years has highlighted the need for lightning-fast data and analytics for making decisions across organizational systems. To manage this extreme uncertainty while optimizing both service levels and inventory, companies are looking for their Supply Chains to be more flexible, responsive, and resilient. Supplier diversity, demand forecasting, and end-to-end Supply Chain visibility have become vital for the survival of modern manufacturers.

Unfortunately, many companies have limited insight into their supplier ecosystems. End-to-end Supply Chain visibility and AI-augmented Supply Chains may be the goal; however, the rate of change makes it difficult to keep pace with technology, and many companies struggle with the basic requirement of accessing and analyzing data created by legacy operational systems. Companies are also challenged with outdated processes heavily reliant on manual inputs and antiquated hardware, and employee turnover that hinders skill and knowledge. It can be overwhelming to solve these problems while trying to understand how to combine the data that exists with the nearly limitless additional data that can be gleaned from equipment, people, and environments.
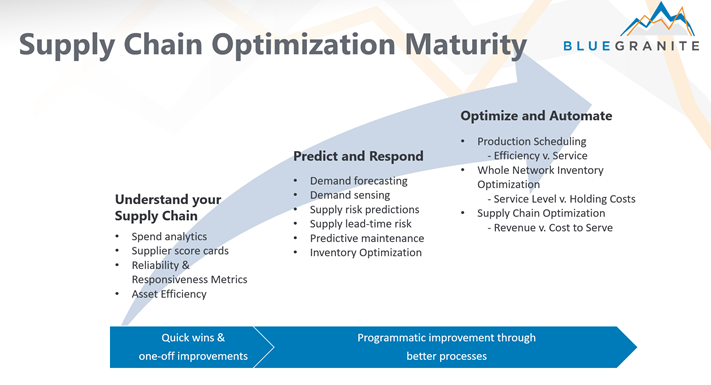
At BlueGranite, we have a saying: “Think Big, Start Small.” To realize the big ideas, it is important to start by maximizing what we already have. As shown in the Supply Chain Maturity Curve below, there are several opportunities to realize quick Supply Chain wins in data and analytics. While it can be tempting to start with more advanced analytics to predict the future and automate the present, a deep understanding of what has already happened is critical to ensuring the right questions are being answered and the right processes automated. The ability to transparently evaluate cash flow, asset and personnel productivity, customer satisfaction, suppler performance and a host of other descriptive analyses requires trustworthy data and the tools to visualize what the data describes.
This blog will focus on one of the most fundamental – Spend Analytics, the process of identifying actionable cost and performance improvements to drive superior procurement decisions. Although Spend Analytics is often used to manage supplier performance or identify cost savings, it can also highlight spending patterns and strategic sourcing opportunities. A few of the most important impacts include:
Faster pattern identification
- Clarity and transparency in spending to quickly identify areas for improvement and to increase the sharing of information across the company.
- Finding answers quickly and efficiently allows both managers and employees to spend more time on adding value.
Improved supplier performance
- Pricing trends – evaluate and optimize both contract and non-contract pricing across business units and locations.
- Payment analysis – negotiate better payment terms with vendors and maximize cashflow and discounts.
- Reliability analysis – ensure orders are being delivered on-time and with high-quality.
- Supplier rationalization – weed out low performers and diversify suppliers for high-risk or high-demand materials.
Better cost management
- Spend under management – Identification of high-performing suppliers for contractual spend.
- Maverick spend – find opportunities for improvement in process to minimize spend outside of approved procurement channels.
- Budget analysis – make sure actual spending is in line with forecasted or budgeted amounts.
- Supply Chain costs – evaluate supplier locations to minimize freight costs and delivery times.
- Direct vs indirect spend – evaluation of the percentage of spend used for producing our goods.
Upgraded procurement efficiency
- PO cycle time – time from purchase request to approval to receipt of the order by the vendor is reduced.
- Buyer efficiency – comparison of key performance metrics to individual buyers.
Spend Analytics Showcase
Check out our Spend Analytics Showcase to see a report showing the results of a real-world manufacturing scenario. This customer was looking for opportunities to improve supplier performance, from purchase order to delivery; understanding of weighted-average payment terms; and visibility into non-managed supplier performance and costs. The data is grouped by product category using a scalable data warehouse, leveraging a modern data platform (MDP) on Microsoft Azure. As such, users can leverage both structured data as well as detailed transactional data in a curated data lake. Purchasing patterns are easy to find through dynamic and cross-filtered dashboards, charts, and tables, allowing management to quickly identify opportunities for cost reduction, supplier consolidation, and contract coverage. Just a few of the ways a report like this can assist users include:
- Analysis of spend – by period, expense category, vendor, manufacturer, and more.
- Investigation of maverick spend – unpredictable spend outside of standard procurement procedures and guidelines. Identify who purchased and what products were purchased as maverick spend.
- Forecast trends to show seasonal cashflow or future cost savings.
- Identify vendor consolidation and negotiation opportunities.
The first page of the demo report, Spend Overview, contains drillable overall spend by category, region, period, and PO. All visualizations, on all pages of the report, are dynamically filtered as users interact with the data, including multiple slicers for better granularity, drill down by period, and drill-through pages for greater detail and insight. Note: right click on a Buyer or Vendor and select Drill through -> “Buyer WAPT” or “Vendor WAPT”.
The next three pages highlight deeper supplier analysis. Supplier Scorecard provides a summary of supplier metrics, helping to quickly find the most cost-efficient vendors. Payment Terms shows average payment terms and delinquency over time, helping to identify patterns in supplier contracts and payments. Preferred Spend compares how the company utilizes preferred vendors to non-preferred, non-contractual spend.
At BlueGranite, we have experience discovering and implementing best practice Supply Chain features for ultimate efficiency within your organization. If you need advice and guidance on the current standing or future enhancements of your setup, let BlueGranite offer some words of wisdom, contact us today!


