Smart devices are everywhere – doorbells, refrigerators, thermostats, TVs, speakers, lights, switches, you name it. If you take a look, I bet you can find at least one device in your home that is connected to the internet. Each of these devices are generating a continuous stream of data. In fact, every human on earth generated 1.7 MB of data per second in 2020 alone. In a business setting, this data can be harnessed to generate valuable insights and conclusions, leading to better outcomes overall.

Imagine you run a large manufacturing corporation consisting of multiple factories and assembly lines. These factories have thousands of machines hooked up to sensors, which are also creating a continuous stream of data. They can communicate temperature, vibration, and the all-around health of the machine every second. As the CEO, this is valuable information that could help you determine optimal levels of production, or let you know if there is a potential malfunction with one of the machines.
 On a smaller scale, an abundance of data is generated during every pitch of a baseball game – pitch speed, type, batter tendencies, weather, etc. This data has led to the rise of Moneyball and Sabermetrics in recent years, and has caused analytics to be a central part of the game of baseball. We could certainly leverage the same approach outlined in this blog to perform real-time analysis of the sport itself, but our focus in this article will be to use simple baseball scores to explore a common use case for streaming data: alerts.
Just as the batter has a fraction of a second to decide if a pitch is worth swinging at, businesses need to make decisions in real-time. Streaming data allows businesses to keep their eye on processes closely and receive alerts if specific or anomalous behavior takes place. The sooner they are made aware of this behavior, the sooner they can act. Using our manufacturer as an example, being alerted of a faulty machine as soon as it breaks would allow the company to avoid a costly production bottleneck or even a potential safety concern.
Azure Event Hub
As mentioned earlier, streaming data consists of many events. These events need to be collected in a centralized location before further analysis can be performed. In the Microsoft Cloud, events are collected and stored as raw JSON objects in Hubs. Machine and sensor data that comes from devices is sent to Azure IoT Hub, which contains tools for managing the devices themselves. Data from other sources (including our example) is sent to Azure Event Hub. Either type of Hub can serve as an input for Azure Stream Analytics.
To get as close as possible to a real-time data stream, I decided to call a REST API that provides baseball scoreboard data every 10 minutes. There are plenty of APIs out there that contain this data, but I chose to use MySportsFeeds, since it had the most up-to-date and detailed information. Since I’m not an app developer by any means, I got to play with another Azure product by setting up a simple Logic App to query the API on a regular schedule and send the results to an Event Hub. Because my app sends data to the Hub, I named it “sender” (creative, I know).
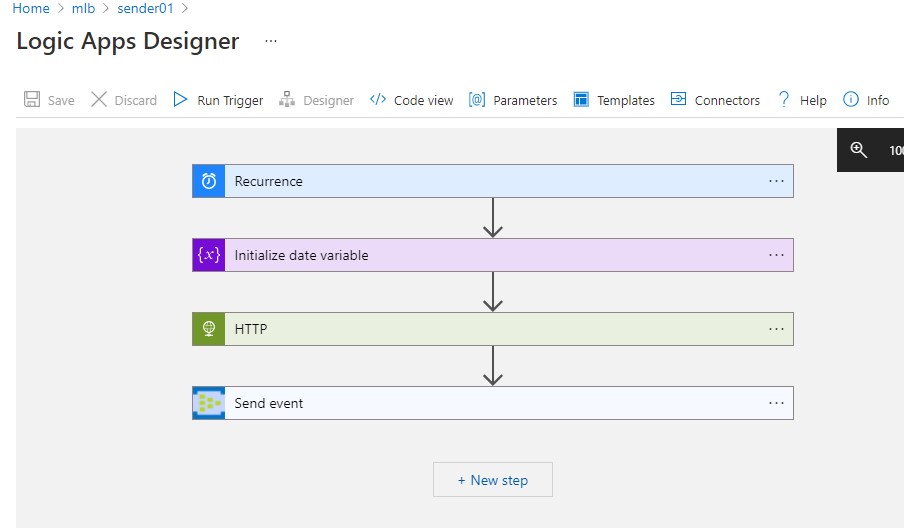
Pictured: The sender app passing date parameters to the MySportsFeeds API Scoreboard endpoint via an HTTP request every 10 minutes and sending the JSON data to the Azure Event Hub.
Once the Logic App is running, you will start to see events landing in the Event Hub. Since the app generates a new event every 10 minutes, we should see 6 incoming events an hour. Keep in mind, this is a very small scale example of a streaming pipeline. Typically, you would see millions of events coming from hundreds or even thousands of devices, which would make a Stream Analytics job all the more important.
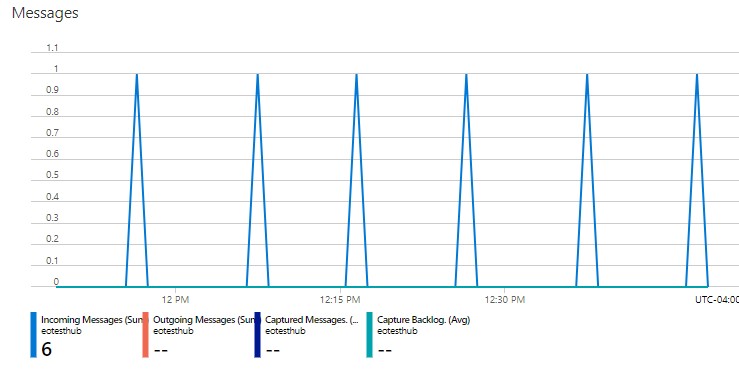
Pictured: streaming throughput of data being received by the Azure Event Hub.
Event Hubs have “Producers”, “Publishers”, and “Consumers”. In our scenario, the API is the Producer, the “sender” app is the Publisher, and Azure Stream Analytics is the Consumer. Next, I will show how I set up an Azure Stream Analytics job containing all of the logic necessary to filter, aggregate, and parse the most recent JSON events based on my alert criteria.
Running an Azure Stream Analytics Job
Using the Event Hub as an input, we can explore the list of events that are housed within the Hub. We can also drill down into a single event and look at the raw JSON. As you can see, there are a whole lot of details coming over in each API result including: a complete list of games scheduled for the day, the location, status, inning, list of players, and most importantly the score.
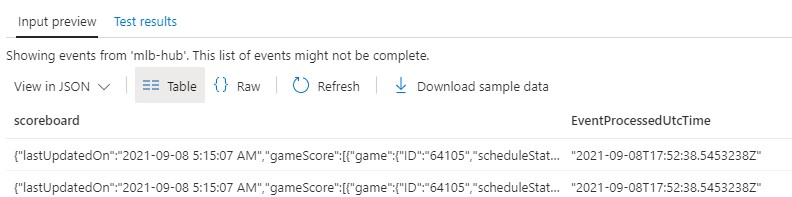
Pictured: Multiple events in Azure Event Hub.
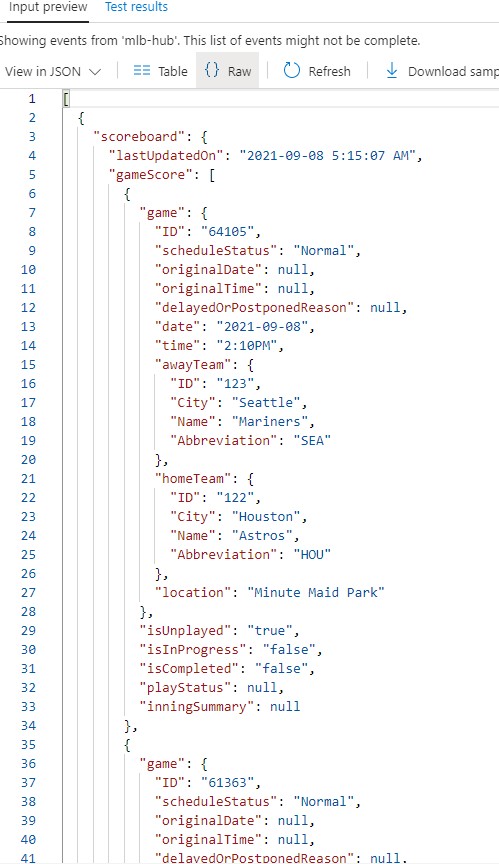
Pictured: The raw JSON object of a single event.
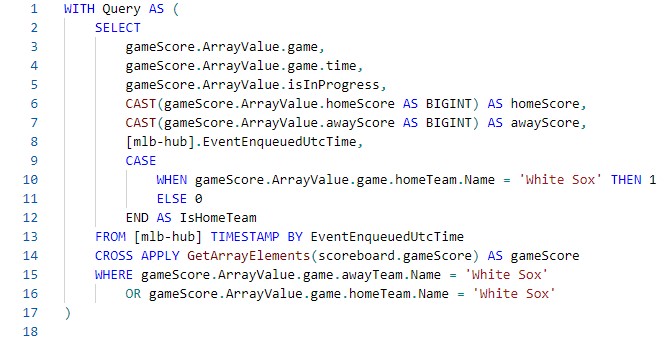
Next, I need to get the most recent event in the last 30 minutes to be sure that I am truly getting real-time data and not looking at stale or duplicate events. This step is particularly important when we have large machine data streams because it can be hard to determine which events to consider when a device’s state could be the same from event to event. Luckily, Azure Stream Analytics comes with a list of windowing functions that allow us to aggregate events based on their relation to one another. When I’m certain that I have the most up-to-date details for the time period, I can create an alert message based on the score.
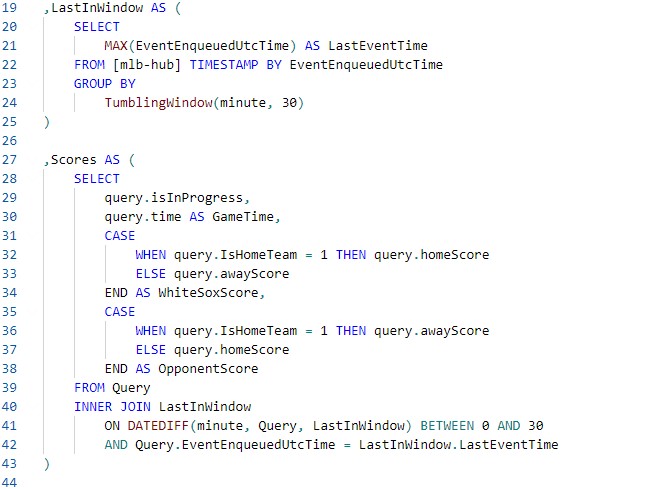
The Common Table Expressions and patterns I’ve used in my query have multiple uses. You saw that I was able to take a subset of the events and aggregate them using windowing functions to find the most recent events in a timeframe. We can also leverage Azure Stream Analytics to write our data to multiple outputs. Possible outputs could include an “archive” zone that is used less often and retains events for longer periods, or a more frequently accessed “alert” zone. In this example, I am using both an archive zone and an alert zone in an Azure Storage Account. Data is only output to the alert zone by the Stream Analytics Job if the alert criteria is met.
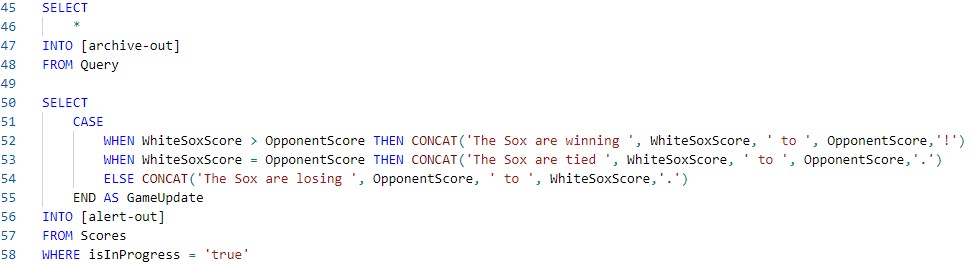 Note: Azure Stream Analytics allows you to use multiple outputs in a single query.
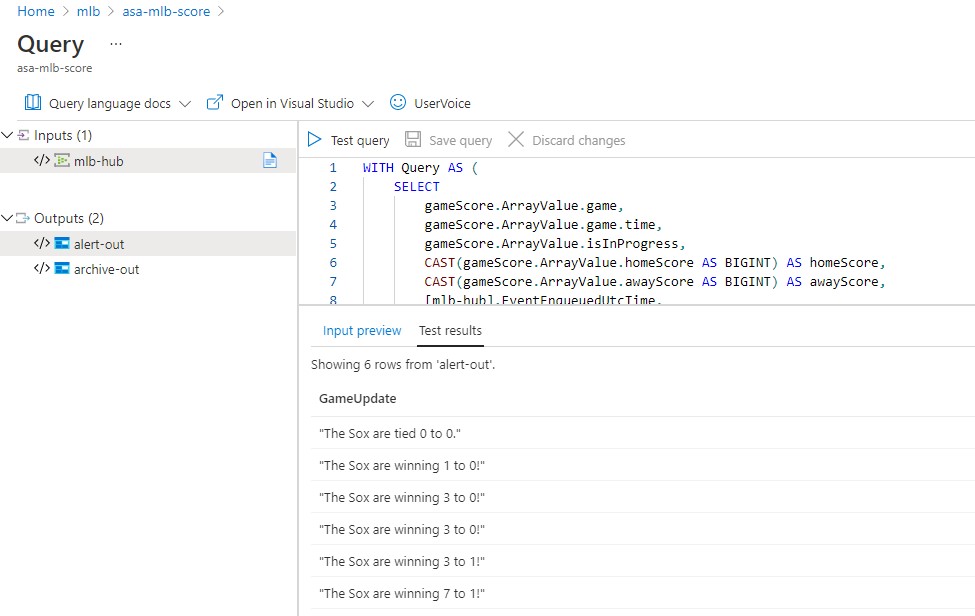
Pictured: Example messages being output to the “alert’ zone.
Setting Real-time Alerts
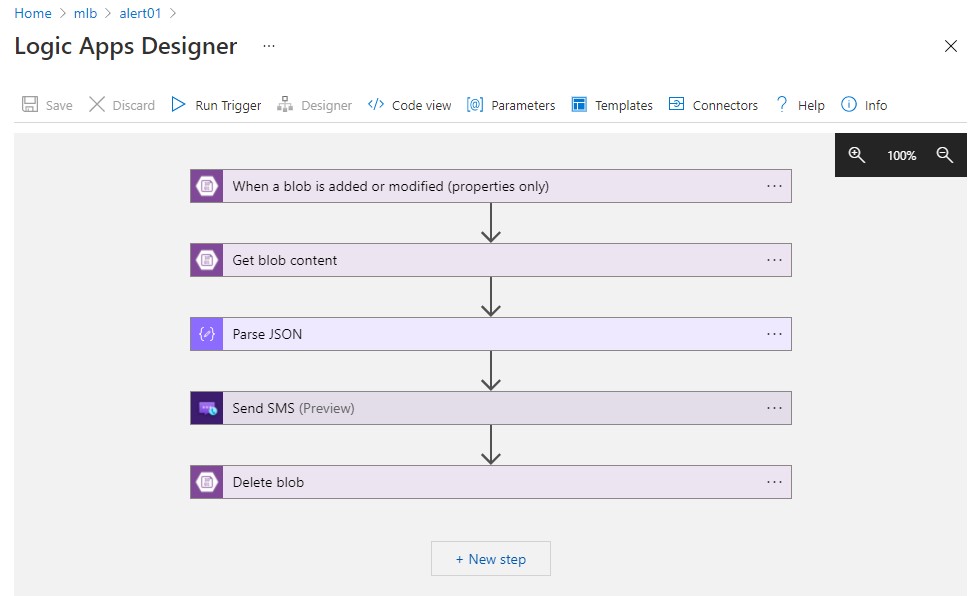
The last step in my streaming pipeline is to make sure the messages in the “alert” zone of the Storage account are being communicated in a timely manner. To accomplish this, I created another trusty Logic App that checks the Storage Account for changes every few minutes, then sends a text message to my cell phone with the alert message created by the Stream Analytics job. I called this app (you guessed it) the “alert” app. It was fun to implement this part, since I got to set up a toll-free number and try out some of the features of Azure Communication Service.
Finally, I turned on both Logic Apps and the Streaming Analytics Job and let them do their thing! The job runs in the cloud as long as new events are being sent to the Event Hub. I knew things were working smoothly when I got a text message with an updated score every half hour during White Sox games ⚾.
In Conclusion
This is a basic example used to mimic a real-time data source and illustrate one of the use cases for Azure Stream Analytics. There are plenty of analytical possibilities using this dataset. The possibilities only grow when you start thinking about larger real-world applications such as manufacturing, fleet management, fraud detection, and sentiment analysis. You could even use Azure Stream Analytics to train a machine learning model using live data before it is distributed to consumers.
Before cloud computing, streaming pipelines were extremely resource-intensive and had to be custom coded to fit the inputs and analytical objectives. Batch jobs remained the norm, requiring end-users to wait hours or days for updated data. With Microsoft Azure, real-time streaming solutions that support almost any source or device can be implemented in a matter of hours with a scalable, serverless compute engine. This removes the barriers to entry and allows businesses of any size to closely monitor their processes and knocks the competition out of the park!
Contact Us
3Cloud has strong experience deploying Stream Analytics on Azure in organizations of all sizes. If you’re interested to learn how Azure Stream Analytics can fit into your modern analytics journey, contact us today!