Metric and goal setting is paramount when formulating business operations. That’s why Microsoft Metrics (previously known as ‘Goals’) make it possible to keep every member of a team striving toward a singular, unified key objective and ensures a higher probability of positive outcomes. In fact, in this study regarding goal setting and optimism, it is shown that the goal setting process assists individual workers to improve their performance and enhances optimism for business success. So, how can productivity metrics and business objectives be met while also integrating the latest and greatest data analysis technology available? In this blog, we will be performing a deep dive into the world of productivity within Power BI’s Metrics and Scorecards.
Power BI Metrics
Currently, most goal tracking systems require manual updates and are not immediately connected to a business’ data source. This makes it difficult to not only maintain metrics, but to dissect them for further analysis. Thankfully, Metrics in Power BI allow businesses to do just that – to take a look inside the data when further analysis is required. Organizations can connect metric targets to data in an existing Power BI Report or, if manually entering metrics is right for your business, the ability to manually enter target values is still available. With Metrics, businesses have the capability to track progress, check metric status, leave notes and comments, and even provide a platform for sharing updates among teammates. A singular, unified view is curated once business metrics are defined. This view then brings in data from across an organization and its workspaces. The Metrics feature is a collaborative and adaptable way to measure key business metrics all while fostering team accountability, unity, and keeping all employees on the same page as to what to strive for as a community.
Creating and Sharing Metrics
By implementing a shared capacity to create metrics within a workspace or organization environment, that organization as an entity provides their workers with an area where they can freely collaborate and build shared visions towards success criteria. Within the Metrics tab, current and target metric values can be connected to data within a report for dynamic tracking. This tracking data can help highlight which areas of business need improvement by monitoring the specific goals that are being attained and those that may be at risk of falling behind schedule. Being able to track corporation wide metrics makes it easier for productivity to thrive because it can help ensure that tasks that shouldn’t be replicated aren’t and that time spent working toward goals are being tracked in a visually appealing way. Metric tracking with Power BI makes it easier for all types of learners because it combines visual, kinesthetic, reading, and writing aspects into a unified report that helps drive productivity.
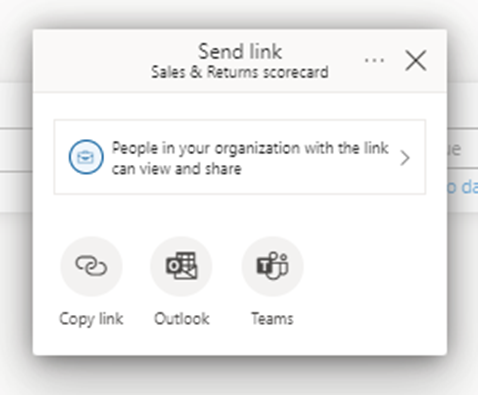
The easiest way to give others access to a metric scorecard is by sharing with users inside your organization. After you share your scorecard with someone, they can immediately view and interact with it, and, depending on their permissions, may be able to edit and share with other employees. The greater visibility brought to organizations with sharing capabilities casts a wider net for other employees to see and provide transparency as to the organization’s performance and path to greater productivity.
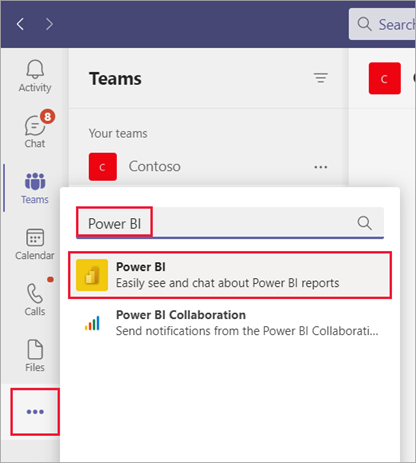
In fact, a more recent edition of Power BI makes sharing metrics across organizations even easier through the Power BI App in Microsoft Teams. All the functionality that comes from power BI service can now be accessed inside Microsoft Teams, allowing members of your organization to do almost everything in Teams, including sharing reports and dashboards and even creating new content. Installing this app is very simple- all you must do is search for Power BI in the left navigation bar (by clicking on the ellipses) in Teams and pin it to the Teams navigation pane. You can even be notified in Teams when you are assigned to a metric, when you are mentioned in the notes of a metric, and when there are metric status updates.
Metric and Details Pane
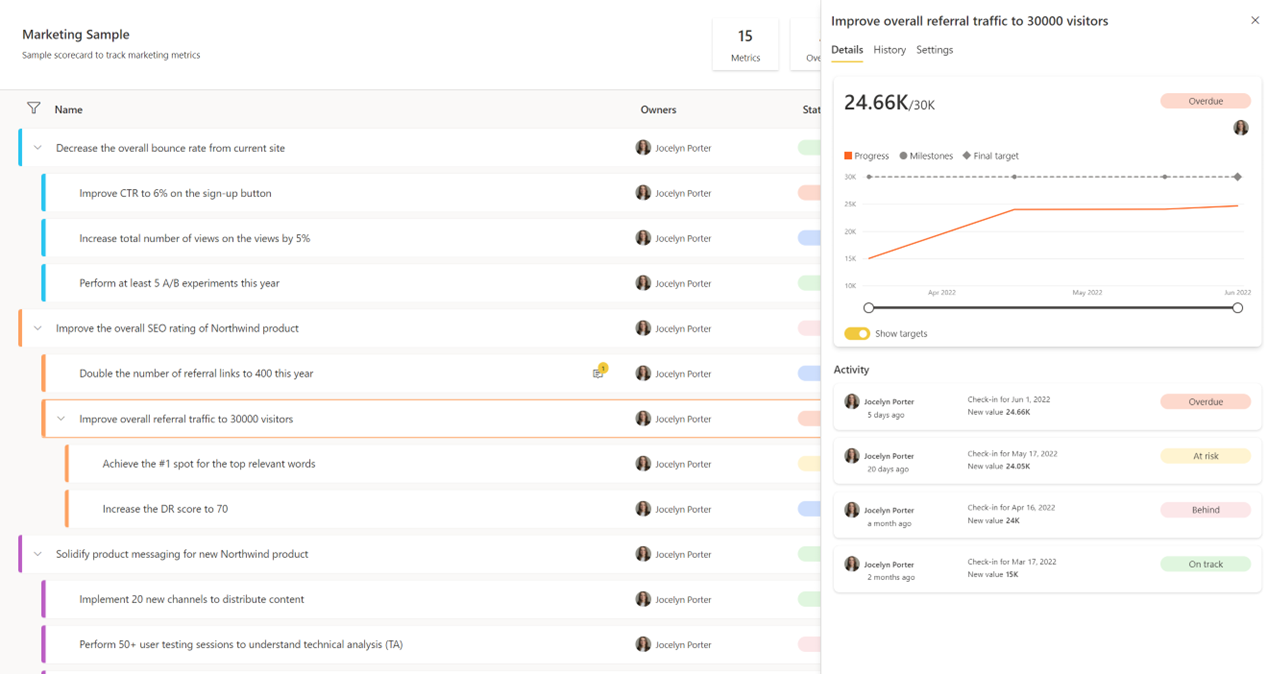
The purpose of the Metric and Details panes is to give the users an overview of the metric history alongside check-ins, status rules, notes, and settings. Power BI automatically gives users access to the Details pane whenever a metric name is selected. By providing further detail with each metric, it becomes more and more attainable. Since most business goals tend to be short term, it is important for them to be very well defined. For example, having a metric be a blanket statement such as ‘Make quota this month’ is not very conducive to productivity within the workplace. We would need to think about our goal and specify how we will reach it by providing a bit more detail as to how frequently we will be measuring it and what metrics we want to compare it to. In this way, users can connect to existing data instead of manually creating their own which is error prone and can lead to confusion. In fact, being able to tie metrics to pre-existing data will allow for greater consistency within the organization’s goal definitions. The purpose of the Metric Details pane is to show progress over time and to motivate users to use their metrics. It also makes it easier to view the history of check-ins and status updates for greater visibility.
Status Rules
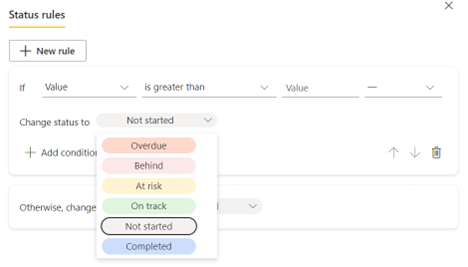
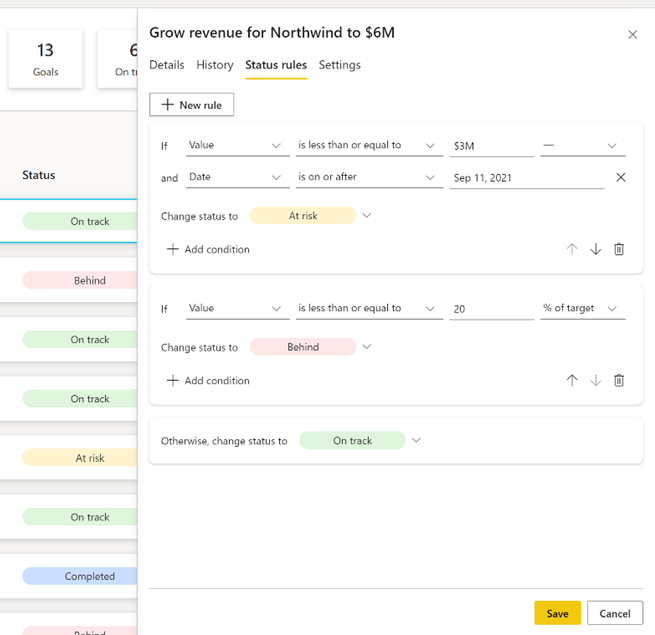
Status updates can be automatically triggered based on rules surrounding metrics or submetrics. Scorecard authors can define when metrics are off-track or failing behind. For example, if you have a metric to meet $5 million in sales by the end of the year, you can label the metric as “At Risk” if the metric will not reach $2.5 million after the second quarter ends. By setting status rules, it will be more feasible to keep track of progress and if adjustments need to be made. There is even a new capability to customize statuses in your Power BI scorecard if users would like to edit their status to reflect company terminology and formatting. All this said, Power BI gives businesses the capability to get ahead of productivity and the guidance of how to set checkpoints.
What is even more impressive is that if users need more information as to why a metric is considered to be “At Risk”, they can drill down further into the underlying report and see more details related to their metrics. This drill down feature is similar to the usability in Power BI reports and dashboards.
Utilizing Submetrics
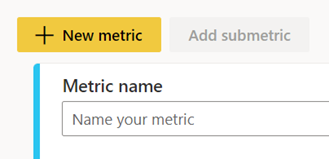
Sometimes to individual employees, accomplishing large corporation goals may feel like biting off too much to chew, however, Power BI makes goals easier to reach by implementing submetrics. Submetrics are created under an existing metric and serve as a method to deepen, specify, and further organize the main original metric. Submetrics serve to give more clarity on these objectives and provide specifics of how the main goal will be met. Being able to break large metrics down into smaller pieces can improve productivity by making seemingly difficult tasks easier to manage and accomplish for employees. Now, since employees are biting off the right sized submetrics, they can be propelled to chew through each goal that’s set until they reach a desired business outcome.
Data Metrics
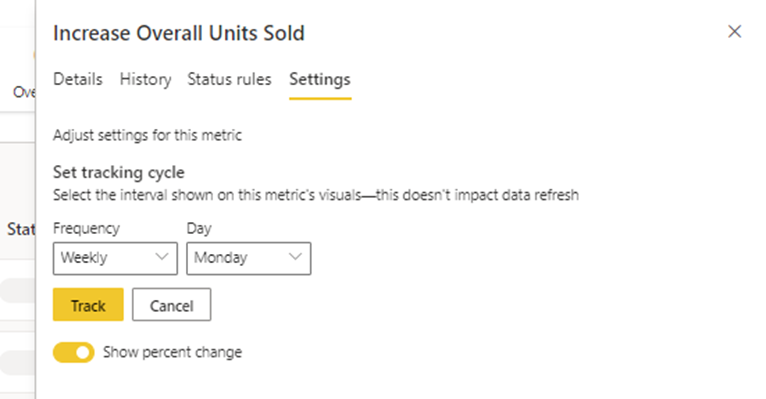
Updating goals and metrics does not have to become a complicated process. Because each metric is different, it is important to be able to track them at varying cadences. It is possible to edit the daily default tracking cycle of each metric in the metric settings and it is great to know that adjusting these settings does not impact data refresh. So, your Power BI data will continually be refreshed independent of the cadence you set for tracking your metrics. This makes managing tasks and roles easier because it shows the most up-to-date and accurate data to compare progress against.
Power BI Metrics also integrates with Power Automate, which may help alleviate the more manual points in the metric creation process by adding triggers and actions. For example, Power Automate can notify business users when the status of a metric falls behind, allowing teams to react to these changing conditions faster and increasing productivity.
Scorecards and Workspaces
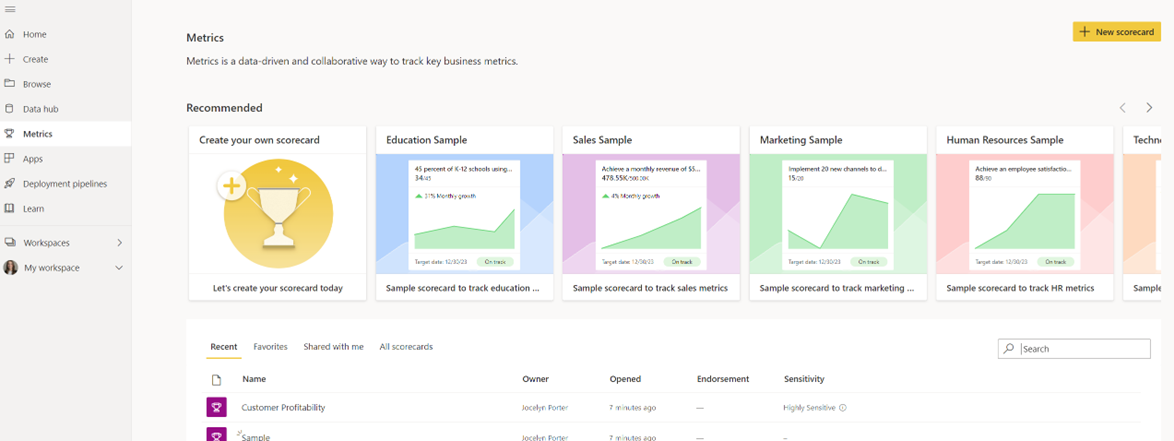
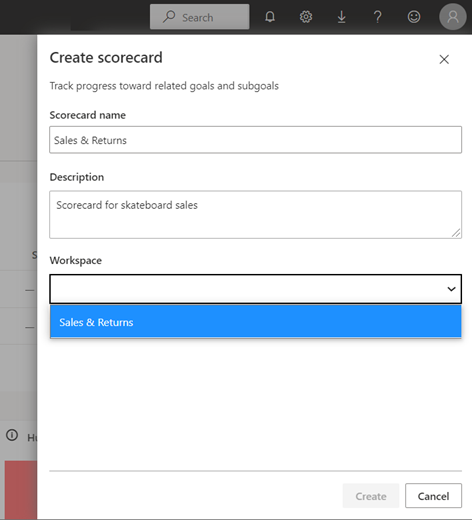
Power BI Scorecards are a centralized platform for visualizing and analyzing Key Performance Indicators for employees, teams, and business areas by allowing organizations to view overall performance and productivity in an aesthetically pleasing way. To create a scorecard within a workspace, users can go into the Metrics hub and select ‘New Scorecard’, bringing up the scorecard creation pane. This pane lets users name their scorecard, give the scorecard a description, and specify the workspace in which it should be housed. Power BI then automatically creates the scorecard itself, and the dataset associated with the scorecard that maintains the data generated by each metric. It is important to note that Metrics can also be integrated into dashboards even if they are from multiple workspaces. When users have Metrics in multiple workspaces, they can use the Metrics tab mentioned above to view progress across every workspace that houses metrics.
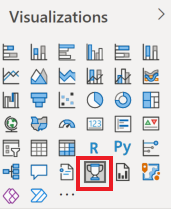
What’s even better is that scorecards can be used as a visual in Power BI reports by connecting to the data in Power BI Service. So, not only is there greater usability with this feature, but metrics and scorecards can be used to develop powerful goals within sharable reports. If your organization likes utilizing formal reports as monthly or quarterly updates, this visual can become a fantastic asset when describing the overall health of the organization. As with other visuals, you have the ability to edit and format the scorecard visual to reflect any organization formatting requirements.
In Conclusion
By fully utilizing Power BI Metrics and Scorecards, you can revolutionize productivity in your work environment. Microsoft Power BI Metrics is a fully customizable and shareable experience in tracking KPI’s that allow businesses to develop a strong platform in aligning business objectives and actionable insights. Scorecards promote consistency and efficiency within an organization by allowing users to take initiative and drive productivity forward through greater transparency.
3Cloud can help you understand how to incorporate Power BI Metrics and Scorecards into your existing implementation or to get started with self-service BI! Contact us today!


