
Microsoft Power BI is a versatile tool. It can be used for reporting, transforming, and modeling data. Additionally, it can be used over batched data loads or streaming datasets, can consume cloud or on-premise data, plus allow access through mobile devices or embedded into custom applications.

Due to Power BI’s varied features and capabilities, when organizations plan to roll it out there can be confusion as to who should use it and how. Is it purely a self-service BI tool meant for power users? Or could it be used by IT personnel, and if so how?
Microsoft released a roadmap for its BI toolset about a year ago, in which Power BI was categorized as an appropriate tool for interactive reporting. This designation can help when planning how to use it, however the question of what type of users should be doing the work was left open. Should these interactive reports be created by business users? How does “shadow IT” fit in the picture?
Unfortunately, purchasing software licenses is not, by itself, an effective rollout strategy. Without a managed framework, power tools can generate chaos and fractures in data management, leading decision makers to question reporting as a legitimate source of information.
To avoid these risks when planning a rollout of Power BI, it is of critical importance to understand who the target users will be and how they plan to use it. Ultimately, success can be measured by user adoption. Listed below, you’ll find the four most important elements to plan for when purchasing and deploying Power BI licenses.
1. Create a branch of IT dedicated to exploratory reporting
Gartner calls this “Mode 2” of a Bimodal IT organization. It is different from traditional IT in that it is focused on exploratory efforts and can cycle quickly to deliver wins.
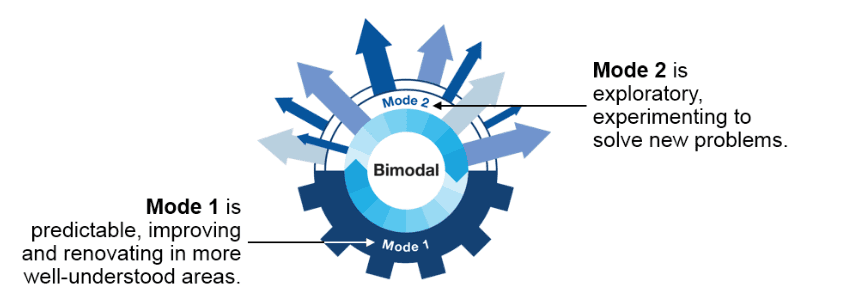
In the context of a Power BI rollout, the Mode 2 team becomes the center of Power BI evangelism. It must be committed to a deep understanding of tool capabilities and appropriate use cases, as well as able to demonstrate value in short order. In that sense, this team is considered to have already adopted Power BI as a key reporting and analysis tool.
Although it is possible for “Shadow IT” teams to perform this function, they typically don’t report to the IT organization, hence their focus is not on technology expertise but on solving business problems. Although tactical solutions can be useful, their narrow focus limits their reach. A Mode 2 Power BI team will instead focus in building a re-usable solution, constantly monitoring the environment and finding opportunities for consolidation.
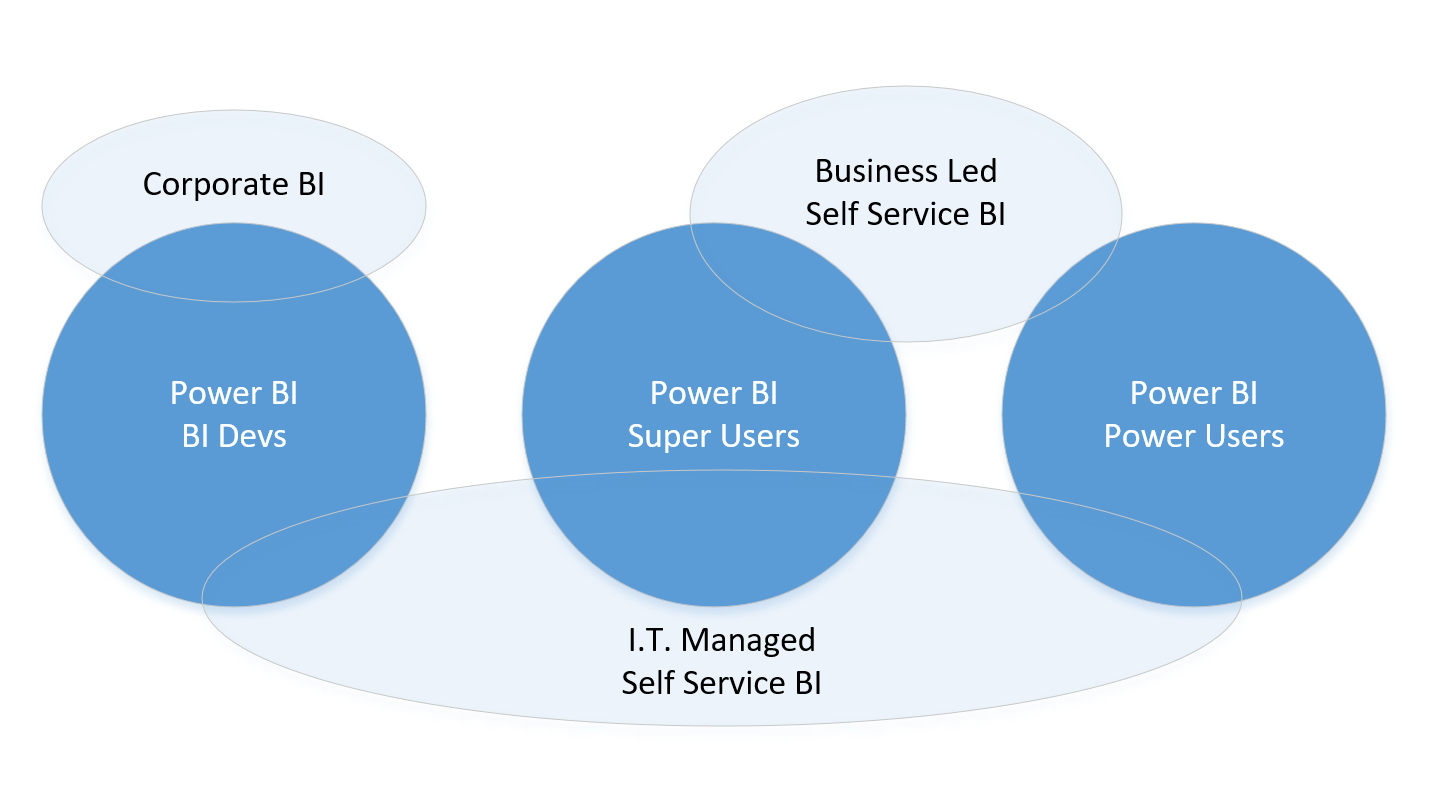
2. Map users to deployment modes
There are three distinct modes in which Power BI can be deployed in an organization:
- Corporate BI: Power BI is used by IT for prototyping and as a tool in the reporting toolset, specifically targeting interactive analysis.
- IT Managed Self Service BI: In this mode, BI or Mode 2 developers build and actively manage the data and semantic layer and business users develop reports. Although they may opt to build the semantic layer in Power BI, that is not a necessity. Business Users will build reports in Power BI Desktop or through the Power BI cloud service by connecting to published Datasets.
- Business Led Self Service BI: Power BI is used by business users to build end to end solutions. They can author data models independently from IT.
There are also four types of users that can use Power BI:
- BI Developers: Normally operating within a Corporate BI context, they use Power BI alongside other reporting tools like SQL Server Reporting Services.
- Super Users: Able to create data transformations, data models and reports/dashboards in Power BI. The exist in Mode 2 teams (within the IT organization) and inside business teams.
- Power Users: Able to create reports/dashboards in Power BI but not data transformations and data models. Typically represented as business users.
- Consumers: Utilize content created on their behalf, mainly business users.
Adoption will look different depending on which deployment mode and user type is being targeted. Please note that is common for multiple deployment modes to co-exist at any given moment.
The Power BI evangelizing group (Mode 2 team) is responsible for crafting a Power BI adoption strategy. To assist, it must categorize individuals in the different categories of deployment and user types.
3. Map Power BI features to deployment modes
There are three main ways to share Power BI content with others: via Content Packs, Group Workspaces, or Power BI Embedded. It is also possible to share individual reports or publish to the Web. These last two will not be discussed here, given their application within a BI program is limited.
- Content Packs mold together data transformation scripts, a data model, and reports/dashboards into a single asset. Although users can make a copy of it and modify/add new reports (to their copy), this use case is discouraged; given that the copy can get out of sync with the original and there is currently no way to merge them. An appropriate use case for internally developed Content Packs is Corporate BI where the original author retains control over the model and reports, and the target audience are consumers that desire minimal setup complexity.
- Group Workspaces allow sharing with other users, which can also be group administrators, read-only users, or editors. One of the best uses for this feature is IT Managed Self-Service BI, enabling BI developers or super users to publish datasets over which power users can build reports and share with consumers. Business super users can also share datasets through workspaces using the same method within a Business Led Self-Service approach.
- Power BI Embedded can be used for rendering Power BI visuals within a custom application. This is a feature that IT will typically own development for, so it is appropriate for Corporate BI deployments.
4. Set adoption targets per deployment mode and monitor usage
Finally, Power BI evangelist teams must set adoption targets for consumers on each of the three deployment modes. This part is not an exact science, but helps to measure expectations against reality and ideally provide a tangible way to confirm business value is being generated through Power BI.
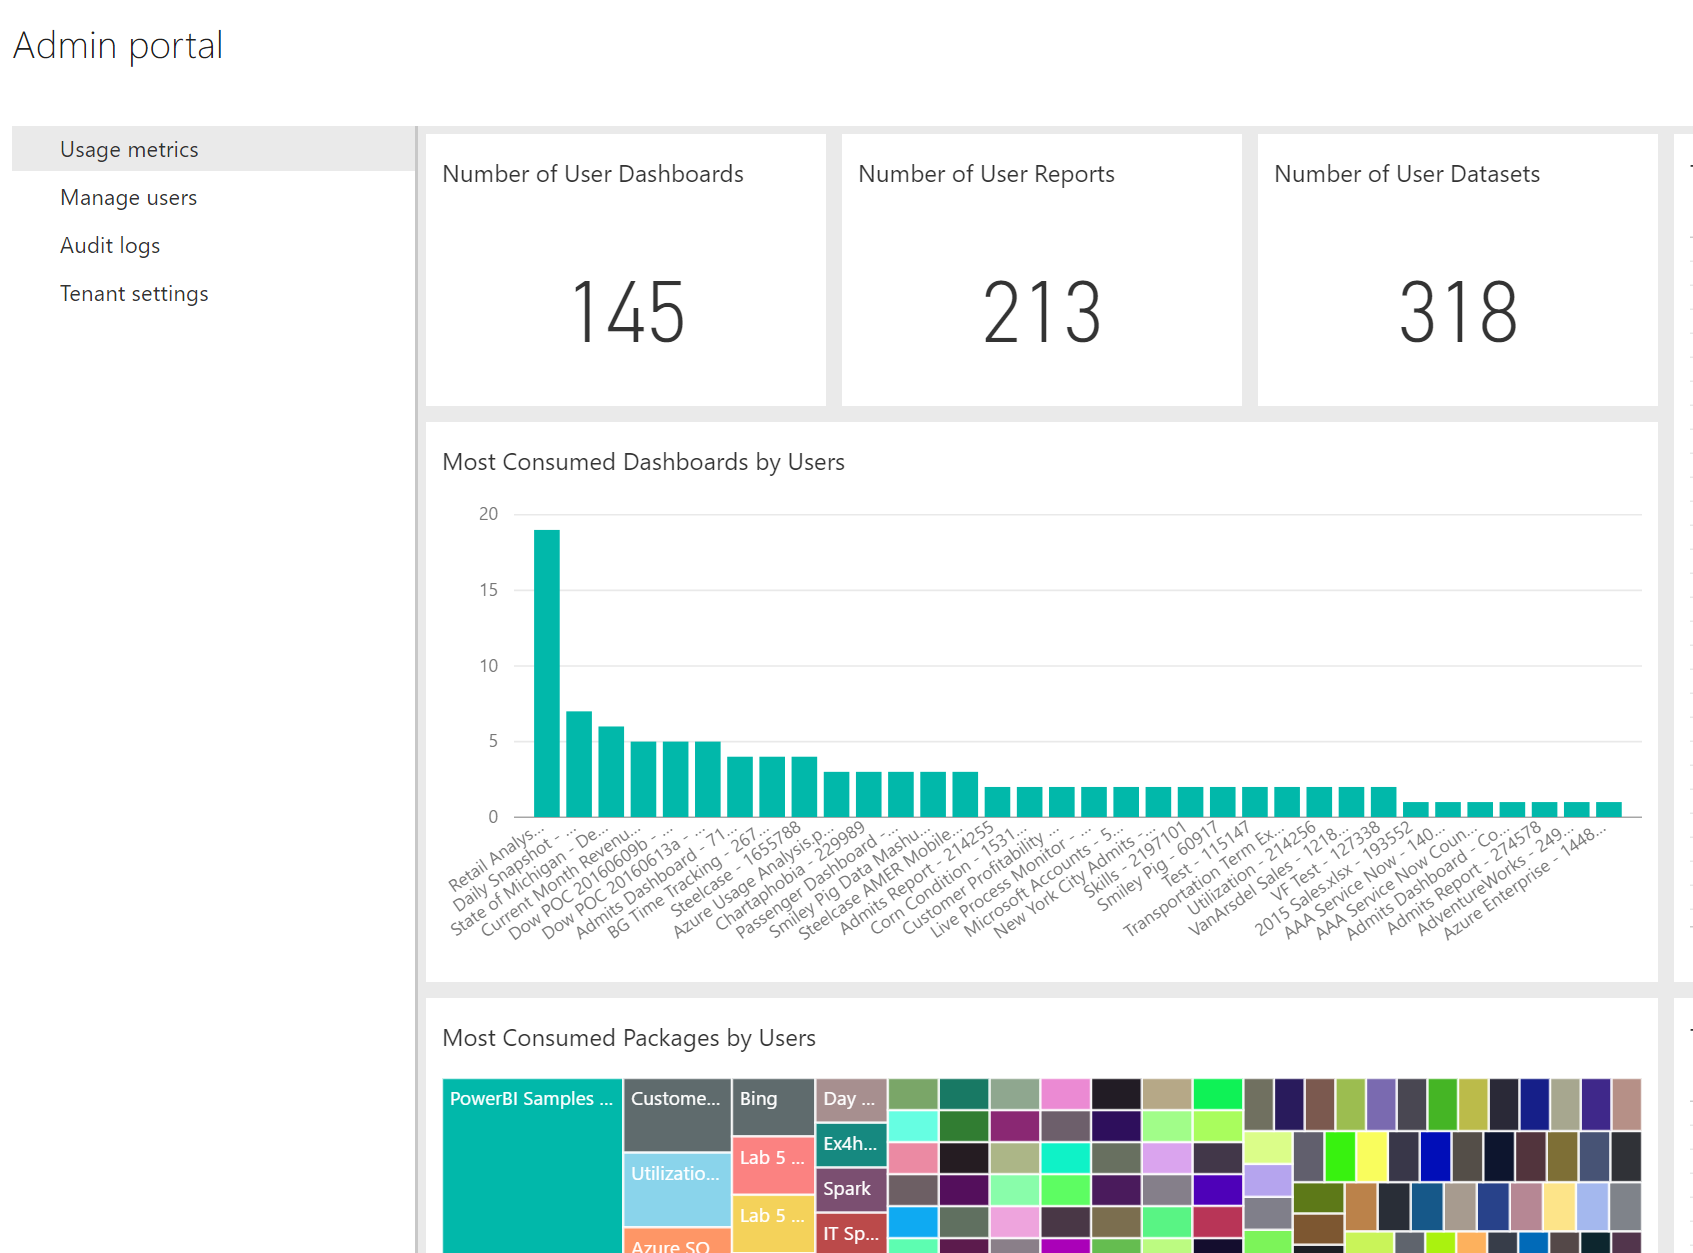
Although Power BI has a built-in Usage Metrics Dashboard available to administrators (shown above), it can be useful to leverage Power BI audit logs to create more customized usage reporting. For example, narrowing to the last 4 weeks:
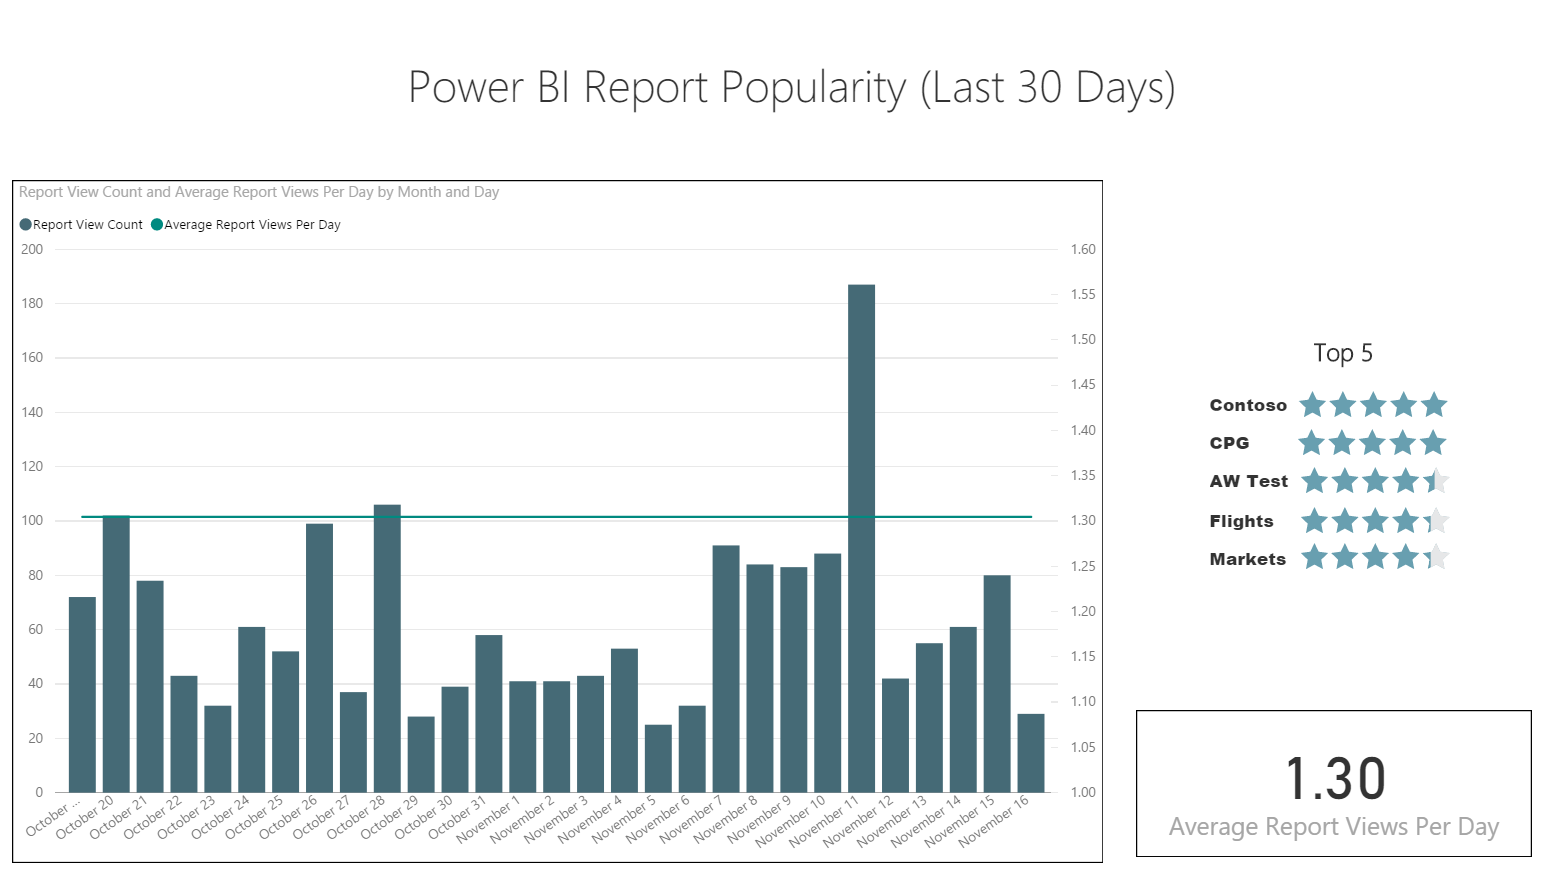
Monitoring usage should not be an afterthought; instead, it should be an assigned responsibility of a Power BI administrator within the Mode 2 IT organization.


