
Since its inception, Power BI has been a leading tool in self-service analytics. This week at Build, Microsoft released an exciting new feature available to preview – Power BI Datamarts! Power BI Datamarts enable self-service users to build and distribute an analytical solution from end-to-end. Data ingestion and preparation, data exploration and analysis, data modeling, and report design can all be done in a low- or no-code experience in Power BI Service!

What is a Datamart?
A datamart can be thought of as a subject-specific data warehouse, often containing data related to one domain or line of business within an organization. Because datamarts are often aligned to a particular business use case, analysts don’t need to write complex queries over large volumes of data as they would against a more traditional data warehouse. This reduces time to insight for organizations and promotes self-service analytics by making structured data accessible to exactly the people who need it.
Power BI Datamarts
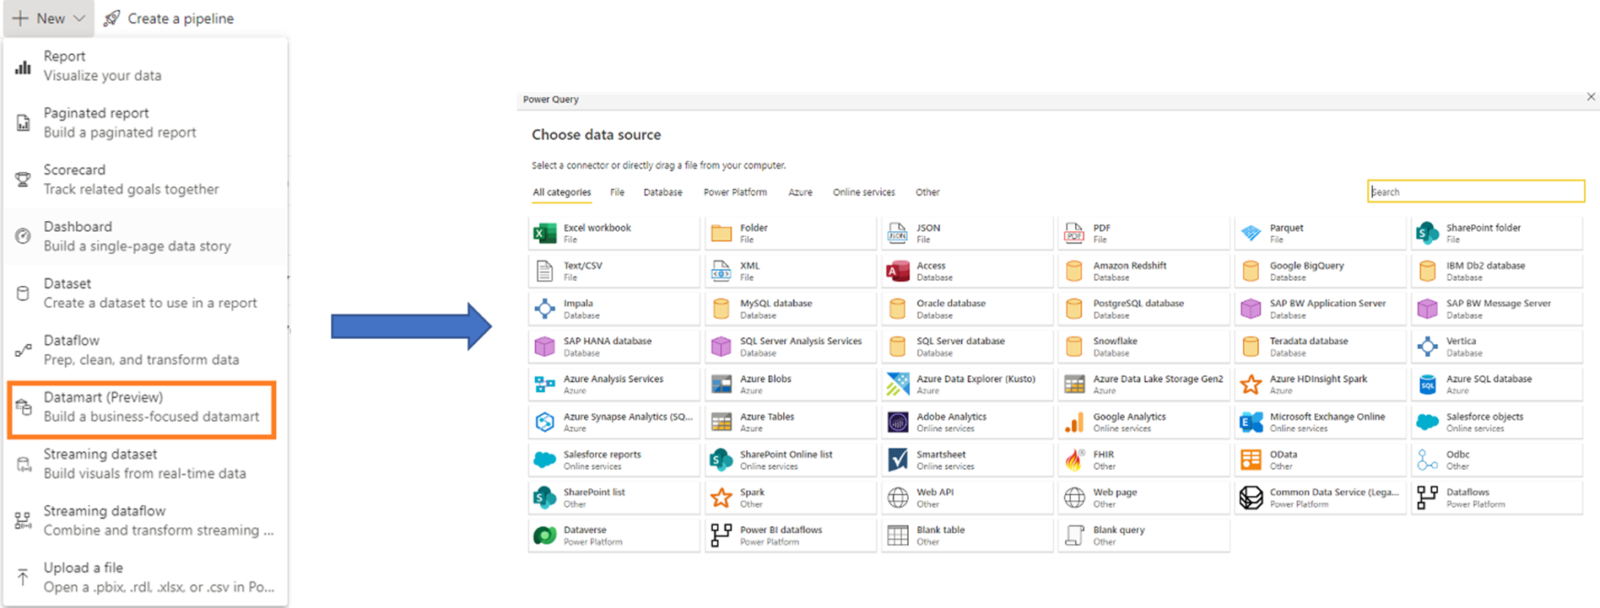
Power BI Premium (per user or per capacity) users can create their own datamarts without reliance on traditional IT resources like a database administrator or cloud architect. Using Power Query, the same engine we know and love from Excel and Power BI Desktop, users can load data from a variety of sources into the Power BI Datamart (an Azure SQL database under the hood). Once data is loaded, the datamart creator can define relationships, write measures, and add Row-Level Security roles – all within Power BI Service!
In this way, Power BI Datamarts build upon the existing functionality of Power BI Dataflows. Dataflows are reusable data entities with the extract, transform, and load (ETL) steps defined. The data elements represented by a dataflow cannot be queried or explored until the dataflow is used in a Power BI dataset.
However, once data is loaded to a Power BI Datamart users can analyze and explore the datamart through writing queries in Power BI Service. The “Design” view of the datamart experience allows users to drag and drop tables from the Objects explorer and leverage the Power Query diagram view experience to explore and analyze data, without ever writing a line of code.
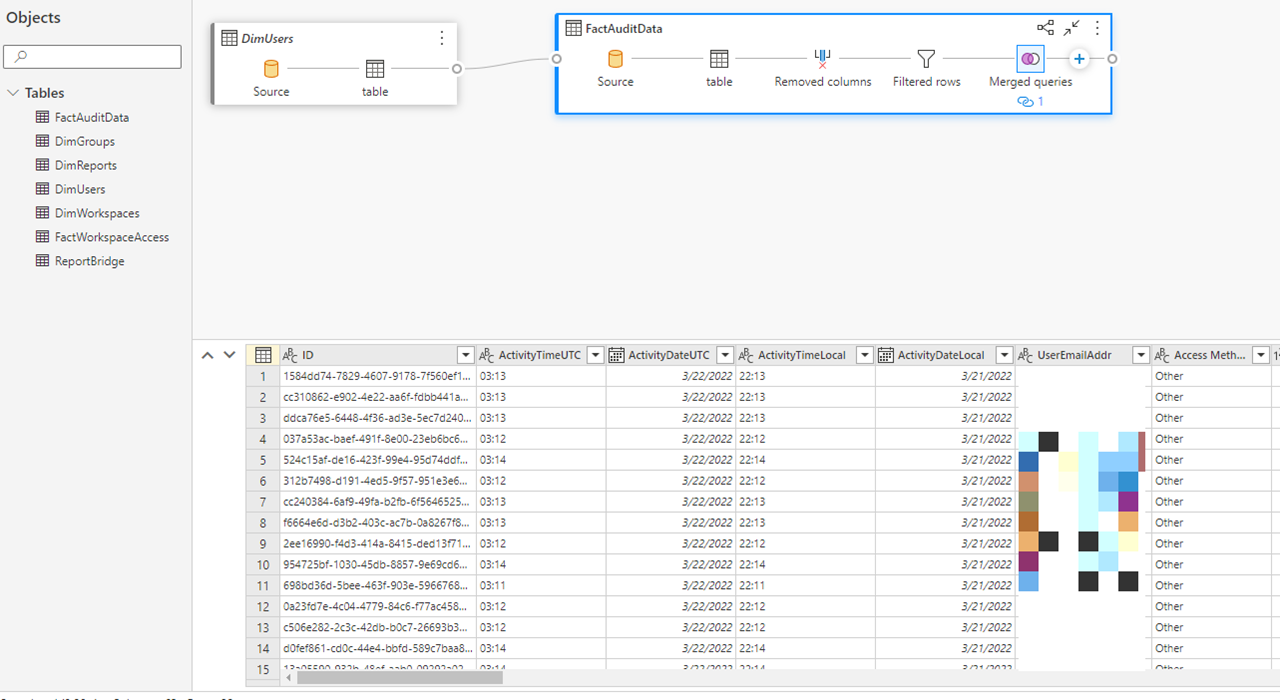
This screenshot shows the no-code PowerQuery steps applied to the table FactAuditData. We can see transformations to remove columns, filter rows, and merge with the table DimUsers. We can explore the results in the table below.
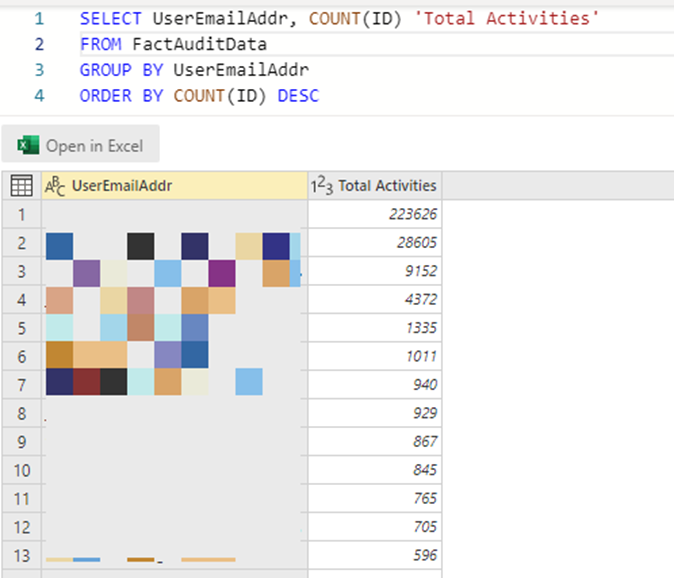
Datamarts also have a built in SQL query editor for users who want to write their own T-SQL queries. Query results can be consumed in the browser or opened in Excel for additional analysis and exploration. Users can also connect to Power BI datamarts through traditional development environments like SSMS or Azure Data Studio.
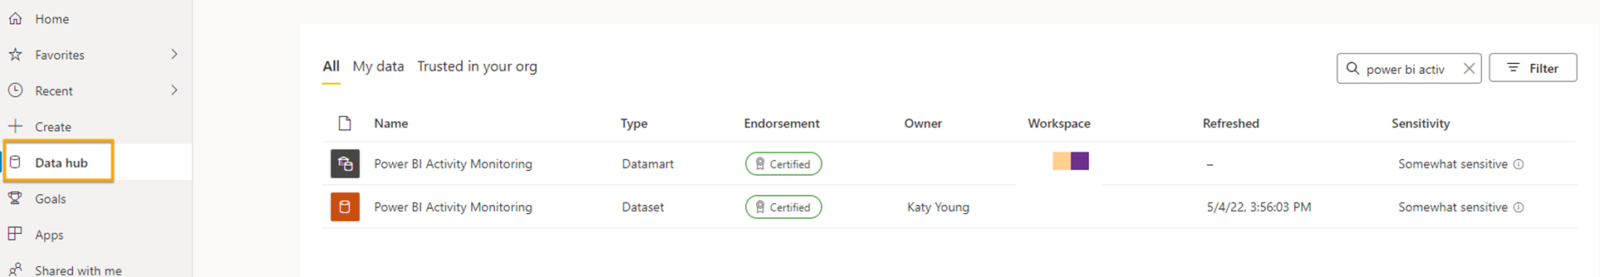
Creating a datamart will provide a semantic layer that is automatically surfaced as a Power BI dataset. This dataset has all the features and functionality of traditional datasets – they can be endorsed, have sensitivity labels assigned, and discovered through the Data hub.
Reports can be authored in Power BI Service or in Power BI Desktop where users can connect to the dataset via Live Connection. Datasets can be extended by creating a composite model – adding an additional data source. For example, imagine an analyst in the Sales division creates a Power BI Datamart for their team with six tables modeled in a star schema:
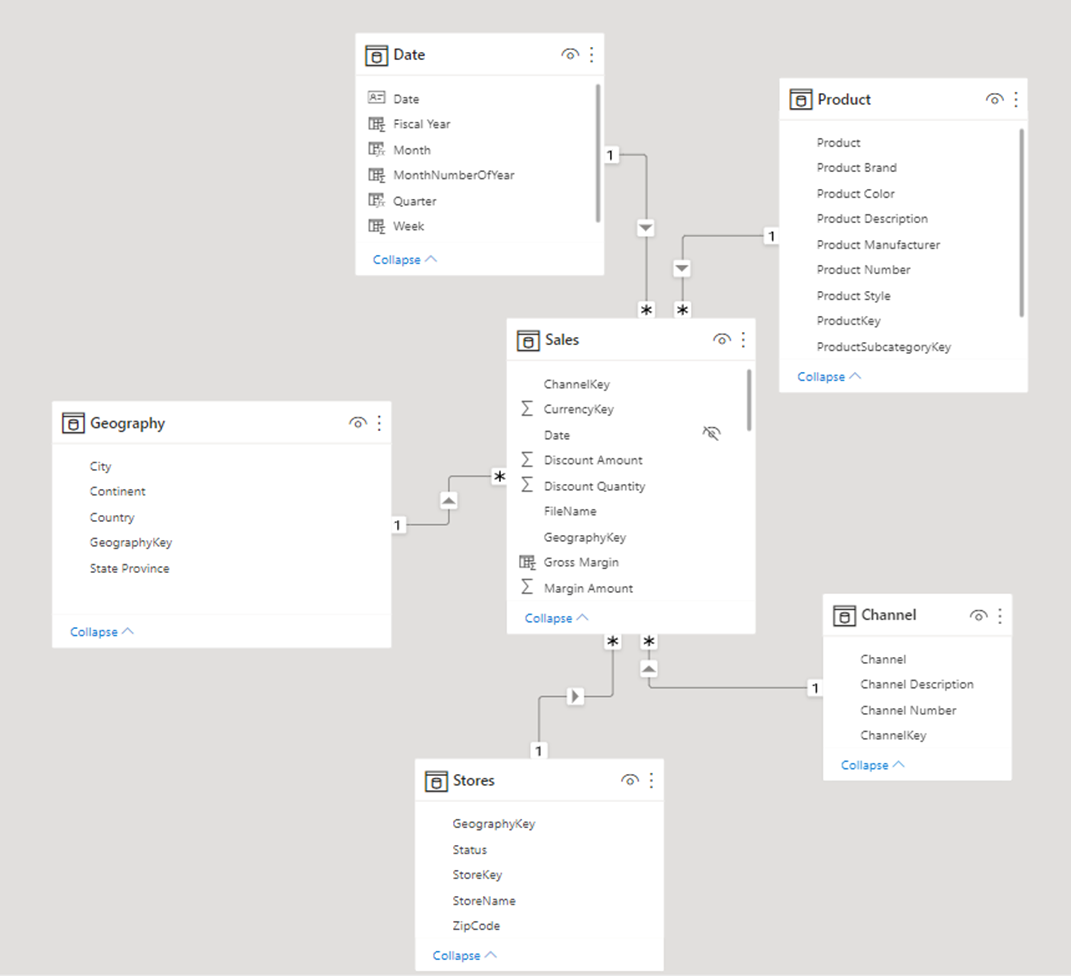
Another analyst on the team has a theory that sales at each store are impacted by weather. They can use the model surfaced by the datamart and add their own additional sources – perhaps an API call to a website with historical precipitation data by zip code. This functionality truly enables self-service teams to create a data universe of their own.
When to use Power BI Datamarts?
Power BI Datamarts are an exciting choice for self-service users and teams who need:
- Independence from traditional IT teams – Power BI Datamarts allow business users to build and manage end-to-end solutions. Data ingestion, preparation, and business logic are all controlled by the business. Business users don’t need to wait for a data engineer or cloud architect to be available.
- Access to centralized data – Users create their own managed SQL databases for downstream modeling and reporting. Data access can be controlled through workspace permissions, dataset permissions, or row-level security. Governance is simplified and business users are empowered to manage their own data.
- Extended analytics with Power BI – Power BI Datamarts can be queried and explored with T-SQL, both online and in your preferred IDE, and eventually in Excel. Azure Synapse and other services in the Azure ecosystem can also leverage Power BI Datamarts. The ability to consume Power BI datamarts downstream in other Office tools and upstream in the Azure ecosystem supports data democratization – making data available to more users who are responsible for solving business problems.
In Conclusion
We are excited to see the capabilities of Power BI Datamarts grow and expand. Empowering business users to create end-to-end analytical solutions can reduce time to insights, democratize data throughout a department or organization, and encourage data exploration and curiosity. 3Cloud can help you understand how to incorporate Power BI Datamarts into your existing implementation or to get started with self-service BI! Contact us today!


