
The business analytics industry has been evolving over the last five years to place more emphasis on self-service, end-user-driven analytical reporting. In response to market needs, many vendors have been broadening their portfolios to offer a wide range of tools that promise to deliver advanced reporting capabilities quickly and without much effort.
However, during implementations we often see users run into data challenges. These challenges, when not addressed properly, can cause users and business managers to lose faith in their ability to take advantage of Self-Service BI. Understanding why these challenges emerge is critical when planning data management strategies that integrate analytical discoveries generated by business users.
To that extent, let’s divide business users into two broad groups:
- Report Writers: Those whose main interest is slicing/dicing/interacting with data with the explicit goal of creating compelling analytical views.
- Data Modelers: Those whose main interest is to organize data to reduce the amount of redundant work required to create reports.
The first group, Report Writers, is a common one among business users interested in creating their own reports. It is important for them to create compelling ways of representing data, for example – animated scatter charts in Power View or 3D map visualizations in Power Map. This is understandable given their reports are likely to attain high visibility among executives, and compelling interfaces are desired or even required. In some cases, Self-Service BI users are the executives themselves.
To the majority of users in the Report Writers category, Self Service BI is all about pivoting, exploring, and visualizing data. Any issues that may arise from joining multiple data sources, handling data quality issues, and producing complex business calculations in order to prepare the dataset may not be something they want to or have time to address directly.
On the other hand, the business of analyzing data has evolved to the point that now users can also model their datasets independently. Although not something that many users want to engage in, it is difficult and sometimes impossible to produce compelling and accurate business reporting without a properly designed data model to support the effort.
A data model can be defined as the physical representation of business concepts, typically in the form of tables of data, the relationships among those tables, as well as business logic to augment analysis such as calculations, hierarchies, and so on. The most successful and far reaching Self-Service BI implementations commonly have well-defined data models as a supporting infrastructure. In the Microsoft world, a data model is a requirement for implementing Self-Service BI and can be created by business users using Power Pivot for Excel, or by technical staff using SQL Server Analysis Services. Developing well-structured Self-Service BI models is critical to the process of ensuring calculation accuracy and reusability, as well as categorization of data structures in business terms that users can understand. Without a sound underlying data model, the analyst’s efforts with reporting and visualization can produce undesired consequences in the form of multiple definitions for a single business metric and/or redundant efforts to prepare data for business reporting.
As important as it is, modeling data is a skill only a small percent of business users are willing to learn and use. A second group of users (the data modelers) are technically savvy and are likely to have a good deal of business expertise. Not surprisingly, they are an attractive asset to any organization. Their modeling activities can be tedious, and require an understanding of applied database fundamentals that other business users do not normally have.
Currently, many organizations are not willing, or able, to staff their business units with at least one data modeler. As a consequence, their ability to develop a robust vision around generating business insight can be severely compromised.
Given these advanced users with data modeling skills tend to be scarce asset, knowing from the start what your options are could be of help. The following flowchart can be of assistance when determining where to focus your efforts when designing a Self-Service BI strategy that can achieve high relevance for the business:
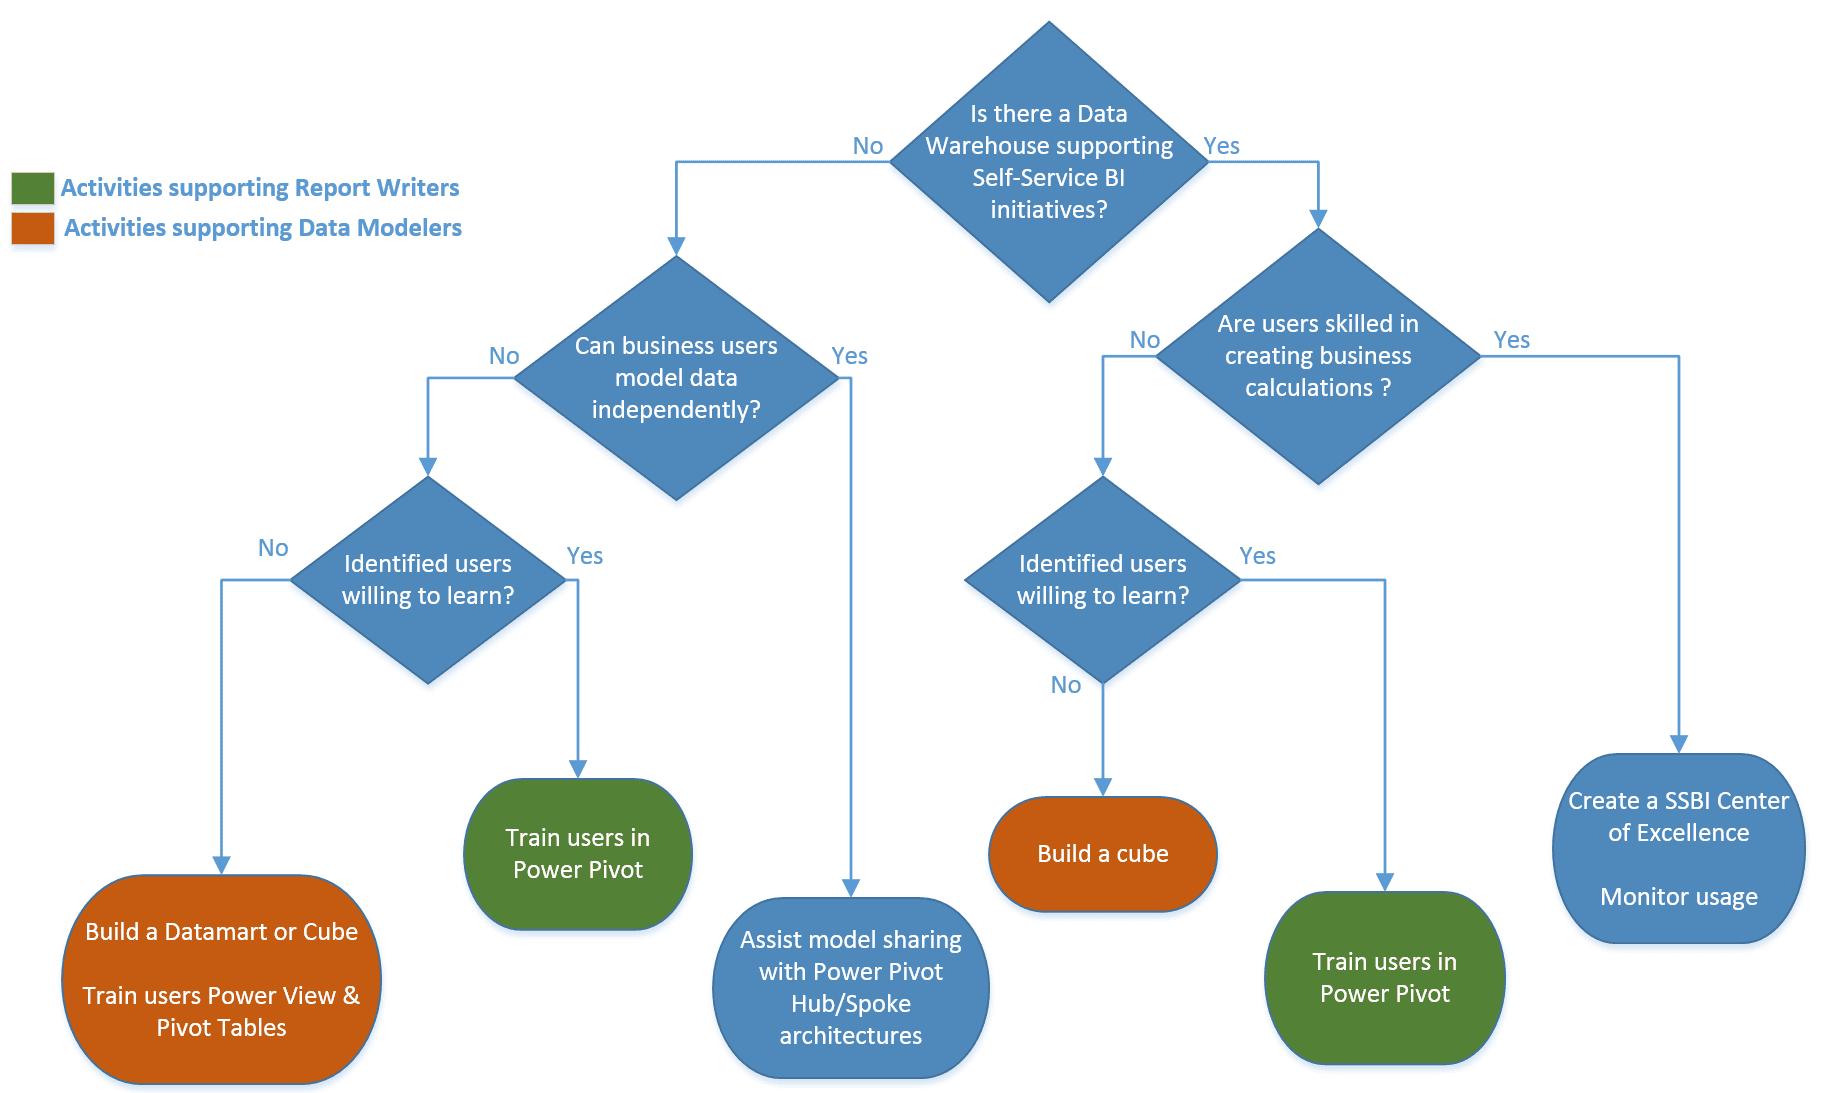
Understanding stakeholder expectations and your team’s current capabilities is key in order to implement the flavor of Self-Service BI that is appropriate or your organization.
Is your organization deploying Microsoft Power BI?
BlueGranite offers hands-on, instructor-led training at your facility to help both business and IT teams adopt Microsoft Power BI for self-service business intelligence and analytics. Up to ten attendees will receive expert-led guidance through a complete set of hands-on labs and training modules. After the training, attendees will be able to acquire data, build data models, and create visualizations quickly and easily with Microsoft Power BI. Click here to learn more.


